


Example gallery
These examples show simple calculations and tasks that can be performed with the RADIS package. Run them locally or in 🔬 Radis-Lab.
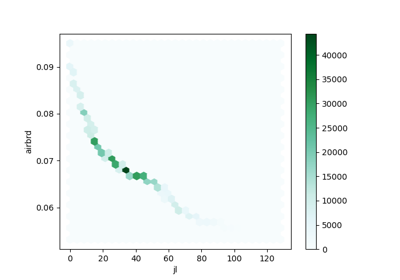
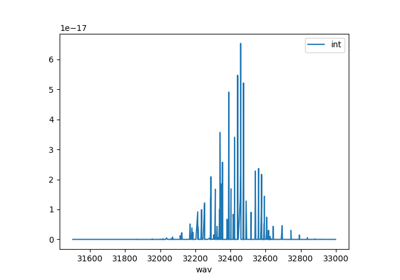
Database handling
Download databases and plot spectroscopic constants with RADIS.


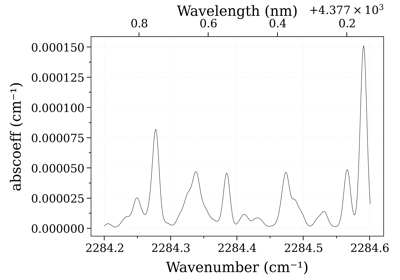


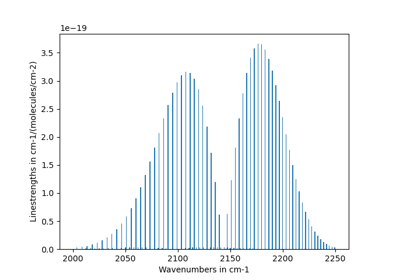
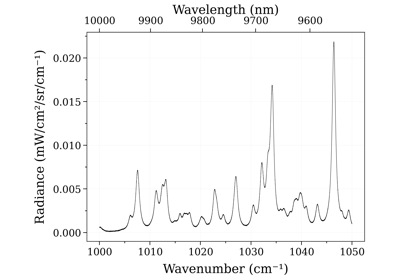
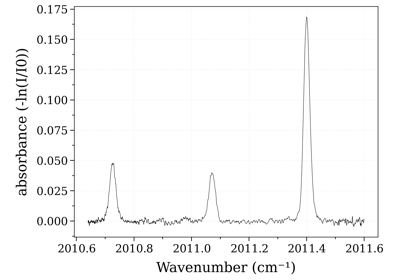
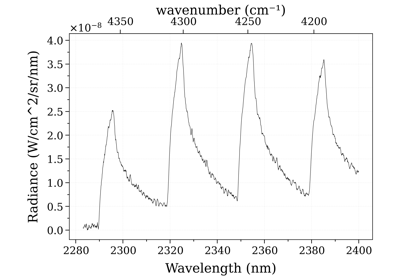
Calculate and handle spectra
Computation of spectra, with redundancy of some modules in the examples. Benchmark of the RADIS code can also be found in \radis\test\benchmark.


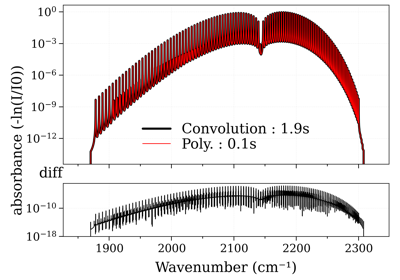
Performance increase of broadening_methods and LDM optimizations.
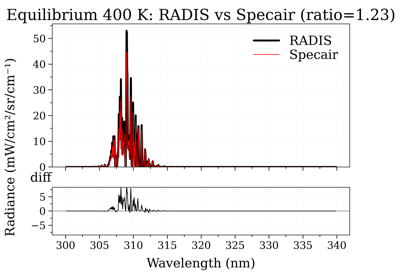
Compare OH(A-X) electronic spectra: RADIS vs Specair


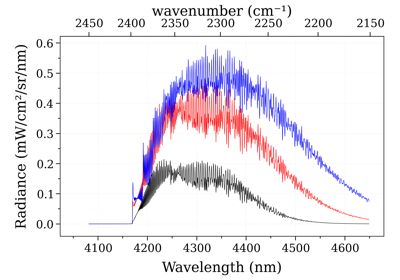
Calculate and Compare Spectra for Multiple Molecules
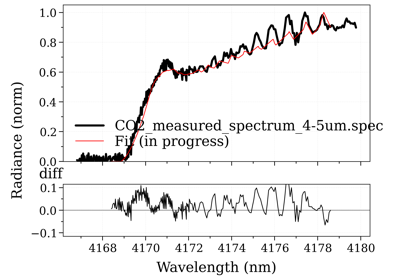
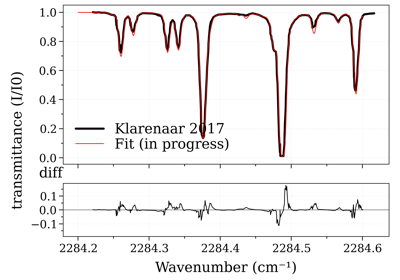
Fitting experimental spectra (basics)
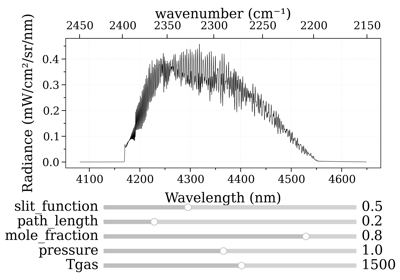
Useful functions to upload experimental data and fit them with simple models.
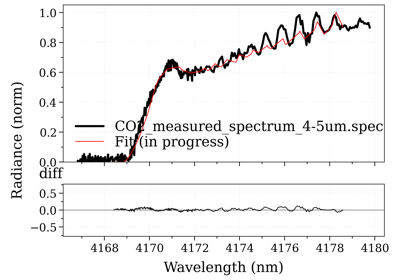
Fitting experimental spectra (advanced)
A wrapper is implemented in RADIS to fit experimental spectra with simulated spectra. We recommend starting with examples #1, #2, and #3. A legacy method is also available.
Example #3: non-equilibrium spectrum (Tvib, Trot, x_CO)
Legacy #2: non-equilibrium CO2 (Tvib_12, Tvib_3, Trot)
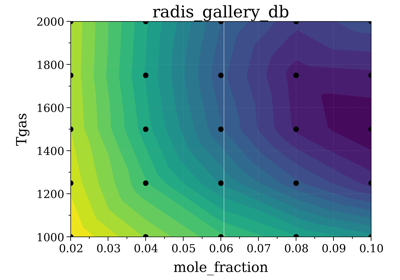
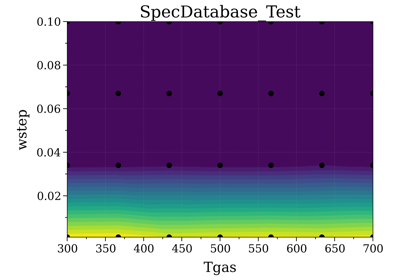
Example #7: Database fitting using SpecDatabase.fit_spectrum
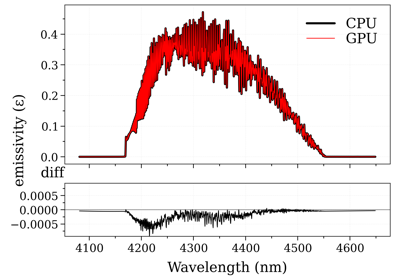
GPU calculations
Unleash the power of your GPU to speed up your calculations.
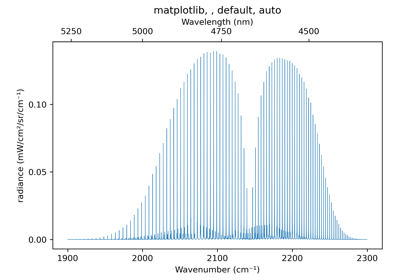
MatLab interface
RADIS can be accessed from Matlab by setting up Python environment in Matlab
s = py.radis.calc_spectrum(1900,2300,molecule='CO',isotope='1,2,3',pressure=1.01325,Tgas=700,mole_fraction=0.1,path_length=1,databank='hitran');
s.apply_slit(0.5,'nm');
s.plot(show=true);

Miscellaneous
Various other things that don’t fit into the other categories.

Footnotes
Radis-Lab allows you to share your session URL with colleagues. They will access the latest saved version of your notebook as long as your session is running.