


Post-process using Specutils
Find peaks or uncertainties using the specutils library. A Radis Spectrum
object can easily be converted to a specutils specutils.spectra.spectrum1d.Spectrum1D
using to_specutils().
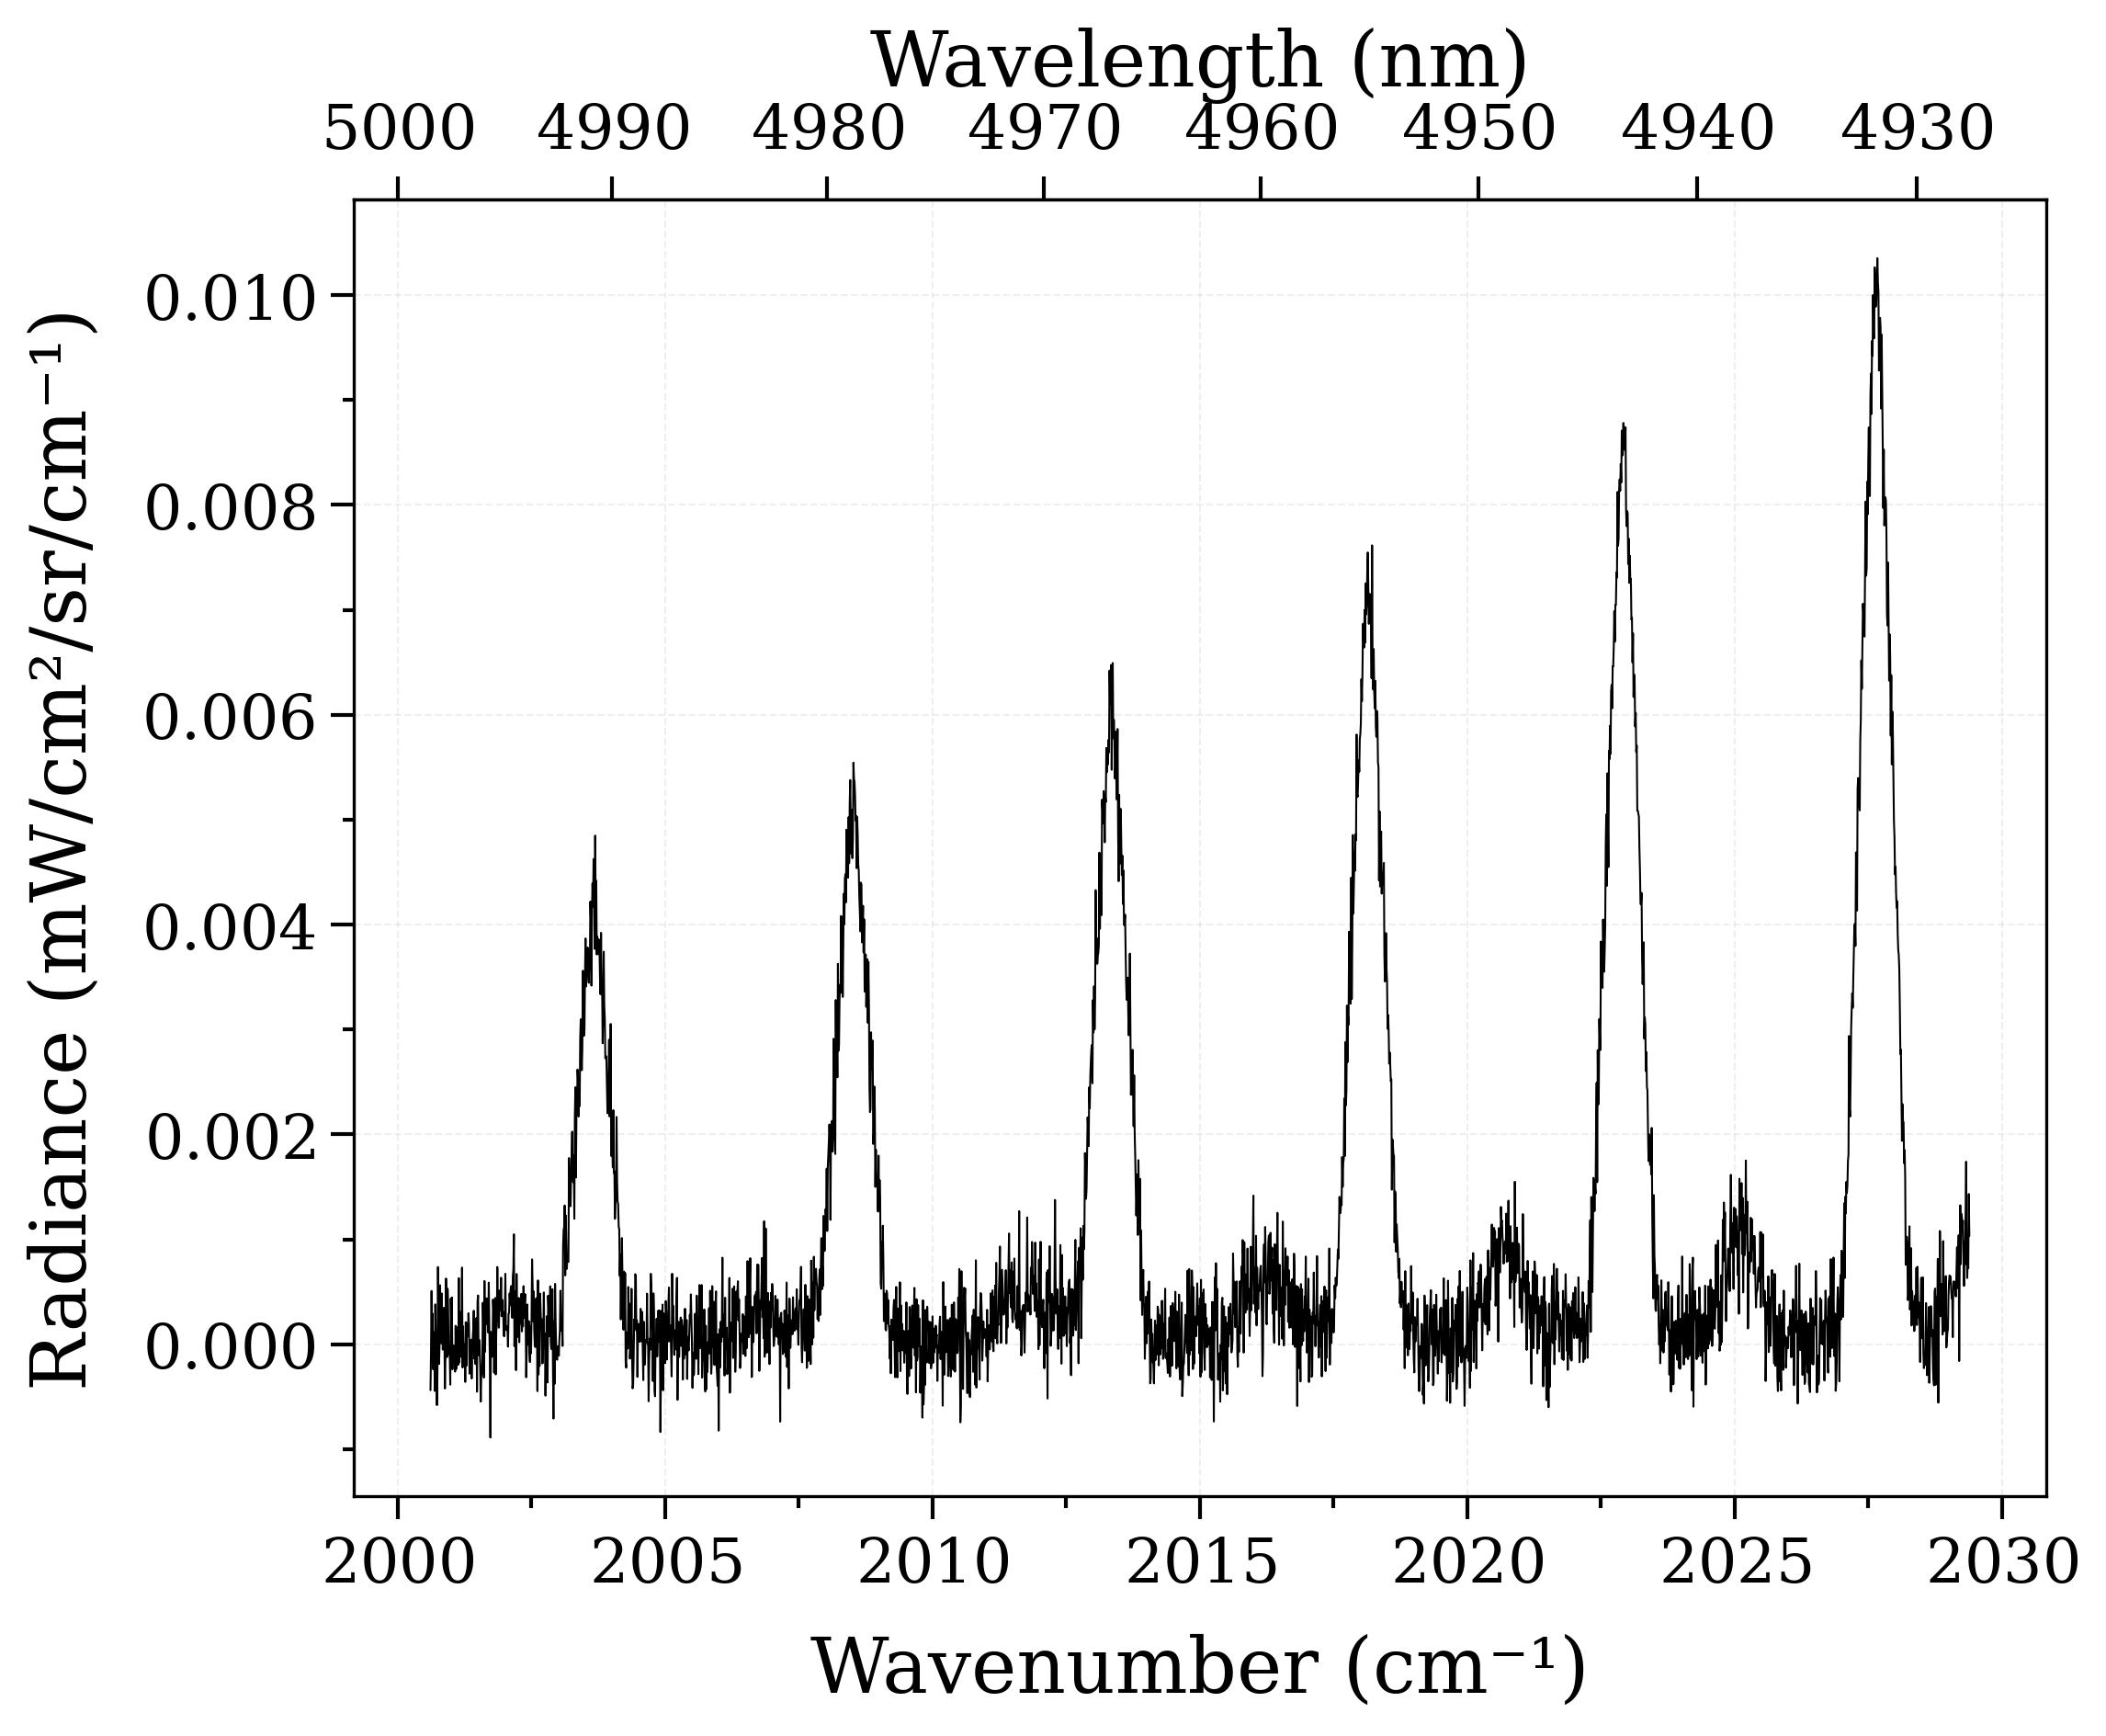
Below, we create a noisy spectrum based on a synthetic CO spectrum,
we convert it to specutils, add uncertainties by targeting a
noisy region, then determine the lines using find_lines_threshold() :
import astropy.units as u
import numpy as np

from radis import spectrum_test

""" We create a synthetic CO spectrum"""

s = (
    spectrum_test(molecule="CO", wavenum_min=2000, wavenum_max=2030)
    .apply_slit(1.5, "nm")
    .take("radiance")
)
s.trim()  # removes nans created by the slit convolution boundary effects
noise = np.random.normal(0.0, s.max().value * 0.03, len(s))
s_exp = s + noise

s_exp.plot()
--------------------------------------------------------------------------------
CO - HITRAN - Downloading database
--------------------------------------------------------------------------------

Download:
- All files already downloaded.

Caching to HDF5/H5 format:
- All files already cached.
0.03s - Loaded database
Calculating Equilibrium Spectrum
Physical Conditions
----------------------------------------
   Tgas                 700 K
   isotope              1,2,3
   medium               air
   mole_fraction        0.1
   path_length          1 cm
   pressure             1.01325 bar
   self_absorption      True
   species              CO
   state                X
   wavenum_max          2030.0000 cm-1
   wavenum_min          2000.0000 cm-1
Computation Parameters
----------------------------------------
   Tref                 296 K
   add_at_used          numpy
   broadening_method    voigt_poly
   cutoff               1e-27 cm-1/(#.cm-2)
   dbformat             hitran
   dbpath               /home/docs/.radisdb/hitran/CO.h5
   diluent              air
   folding_thresh       1e-06
   include_neighbouring_lines  True
   isatom               False
   isneutral            None
   lbfunc               None
   memory_mapping_engine  auto
   neighbour_lines      0 cm-1
   optimization         simple
   parsum_mode          full summation
   pfsource             default
   potential_lowering   None
   pseudo_continuum_threshold  0
   sparse_ldm           True
   truncation           50 cm-1
   waveunit             cm-1
   wstep                0.01 cm-1
   zero_padding         3001
----------------------------------------
0.02s - Spectrum calculated

<matplotlib.lines.Line2D object at 0x71bd67d7ef90>
Determine the noise level by selecting a noisy region from the graph above :
spectrum = s_exp.to_specutils()

from specutils import SpectralRegion
from specutils.manipulation import noise_region_uncertainty
from specutils.spectra import Spectrum1D

noise_region = SpectralRegion(2010.5 / u.cm, 2009.5 / u.cm)
spectrum = noise_region_uncertainty(spectrum, noise_region)
if not isinstance(spectrum, Spectrum1D):
    spectrum = Spectrum1D(
        flux=spectrum.flux,
        spectral_axis=spectrum.spectral_axis,
        uncertainty=getattr(spectrum, "uncertainty", None),
        wcs=getattr(spectrum, "wcs", None),
        mask=getattr(spectrum, "mask", None),
        meta=getattr(spectrum, "meta", None),
    )
/home/docs/checkouts/readthedocs.org/user_builds/radis/checkouts/latest/radis/spectrum/spectrum.py:4394: AstropyDeprecationWarning: The Spectrum1D class is deprecated and may be removed in a future version.
        Use Spectrum instead.
  return Spectrum1D(
/home/docs/checkouts/readthedocs.org/user_builds/radis/conda/latest/lib/python3.14/site-packages/astropy/nddata/mixins/ndslicing.py:68: AstropyDeprecationWarning: The Spectrum1D class is deprecated and may be removed in a future version.
        Use Spectrum instead.
  return self.__class__(**kwargs)
/home/docs/checkouts/readthedocs.org/user_builds/radis/conda/latest/lib/python3.14/site-packages/specutils/spectra/spectrum.py:582: AstropyDeprecationWarning: The Spectrum1D class is deprecated and may be removed in a future version.
        Use Spectrum instead.
  return self.__class__(**alt_kwargs)
/home/docs/checkouts/readthedocs.org/user_builds/radis/checkouts/latest/examples/2_Experimental_spectra/plot_specutils_processing.py:47: AstropyDeprecationWarning: The Spectrum1D class is deprecated and may be removed in a future version.
        Use Spectrum instead.
  spectrum = Spectrum1D(
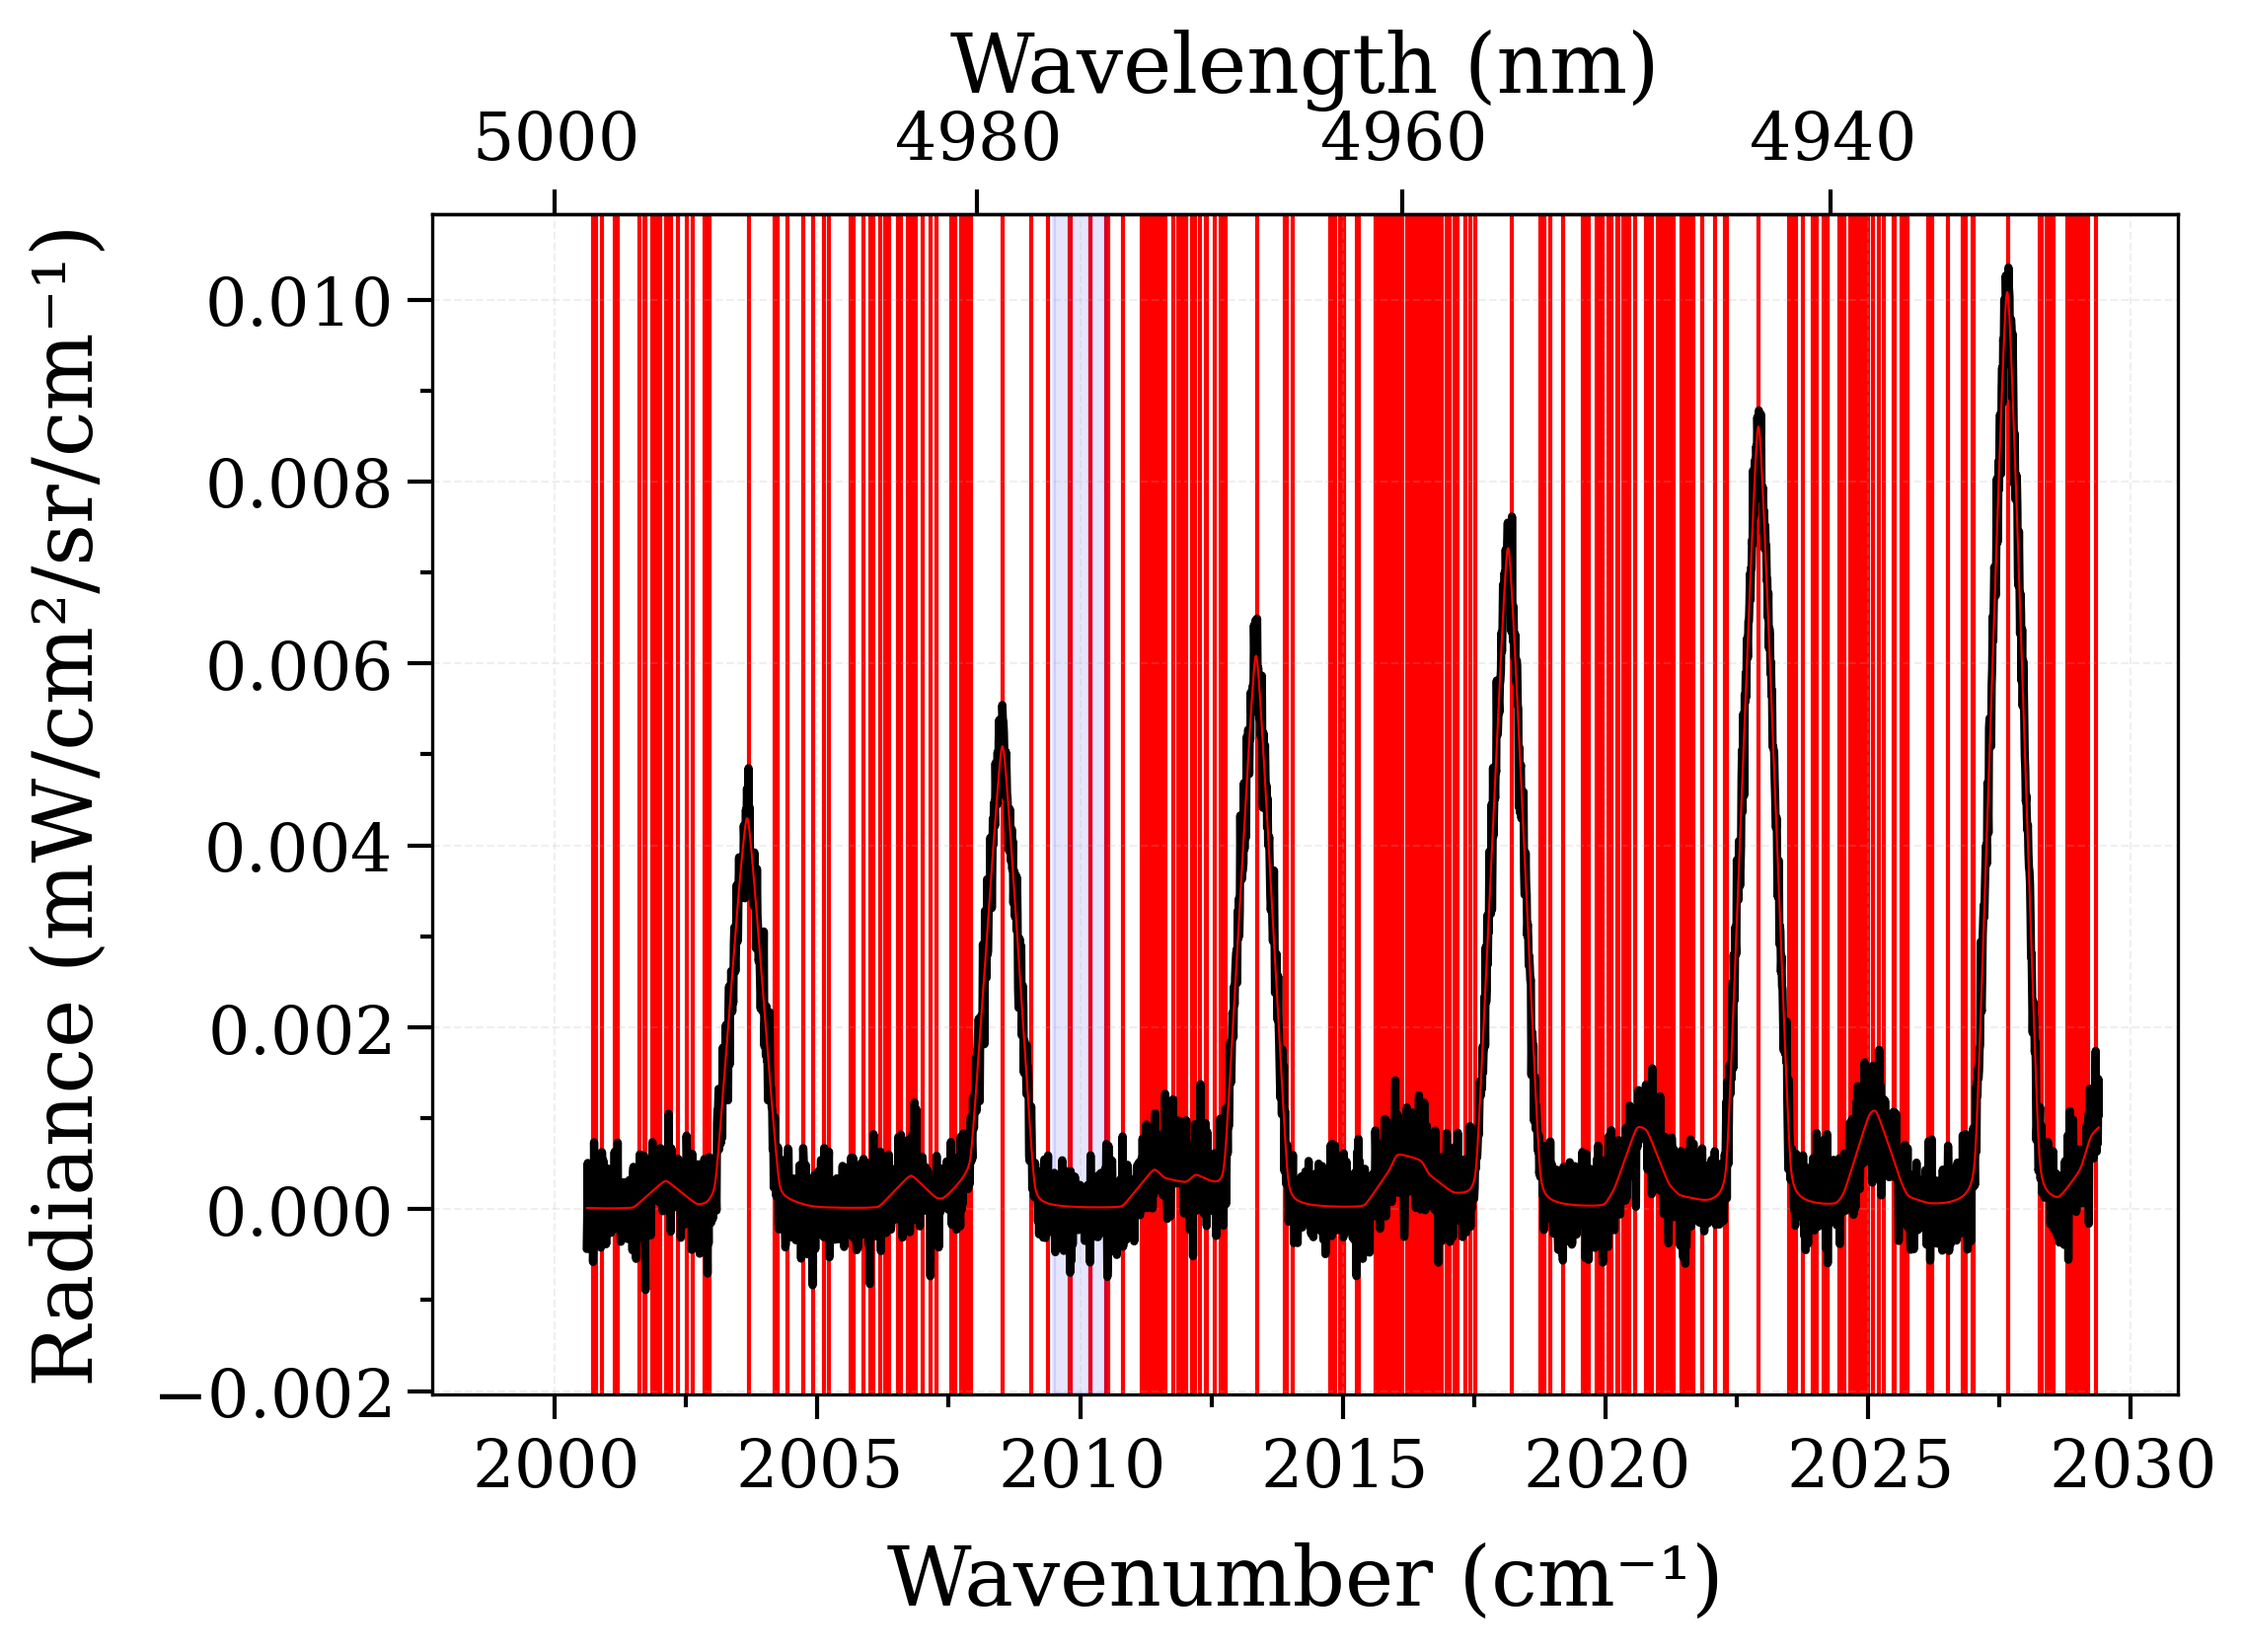
Find lines :
from specutils.fitting import find_lines_threshold

lines = find_lines_threshold(spectrum, noise_factor=2)

print(lines)


s_exp.plot(lw=2, show_ruler=True)
import matplotlib.pyplot as plt

for line in lines.to_pandas().line_center.values:
    plt.axvline(line, color="r", zorder=-1)
s.plot(nfig="same")
plt.axvspan(noise_region.lower.value, noise_region.upper.value, color="b", alpha=0.1)
/home/docs/checkouts/readthedocs.org/user_builds/radis/conda/latest/lib/python3.14/site-packages/specutils/analysis/flux.py:289: AstropyUserWarning: Spectrum is not below the threshold signal-to-noise 0.01. This may indicate you have not continuum subtracted this spectrum (or that you have but it has high SNR features).

If you want to suppress this warning either type 'specutils.conf.do_continuum_function_check = False' or see http://docs.astropy.org/en/stable/config/#adding-new-configuration-items for other ways to configure the warning.
  warnings.warn(message, AstropyUserWarning)
   line_center     line_type  line_center_index
      1 / cm
------------------ ---------- -----------------
2000.6599999999994   emission                 5
 2001.109999999999   emission                50
 2001.159999999999   emission                55
2001.6799999999985   emission               107
2001.9299999999982   emission               132
2001.9799999999982   emission               137
2002.0299999999982   emission               142
2002.0499999999981   emission               144
 2002.209999999998   emission               160
               ...        ...               ...
2005.1899999999953 absorption               458
 2005.579999999995 absorption               497
2007.3999999999933 absorption               679
2010.0799999999908 absorption               947
2010.3299999999906 absorption               972
2014.5599999999868 absorption              1395
2019.6499999999821 absorption              1904
2021.6699999999803 absorption              2106
  2022.10999999998 absorption              2150
2023.8599999999783 absorption              2325
Length = 221 rows
/home/docs/checkouts/readthedocs.org/user_builds/radis/checkouts/latest/radis/tools/plot_tools.py:615: UserWarning: Couldn't add Ruler tool (still an experimental feature in RADIS : please report the error !)
  warn(

<matplotlib.patches.Rectangle object at 0x71bd67844f50>
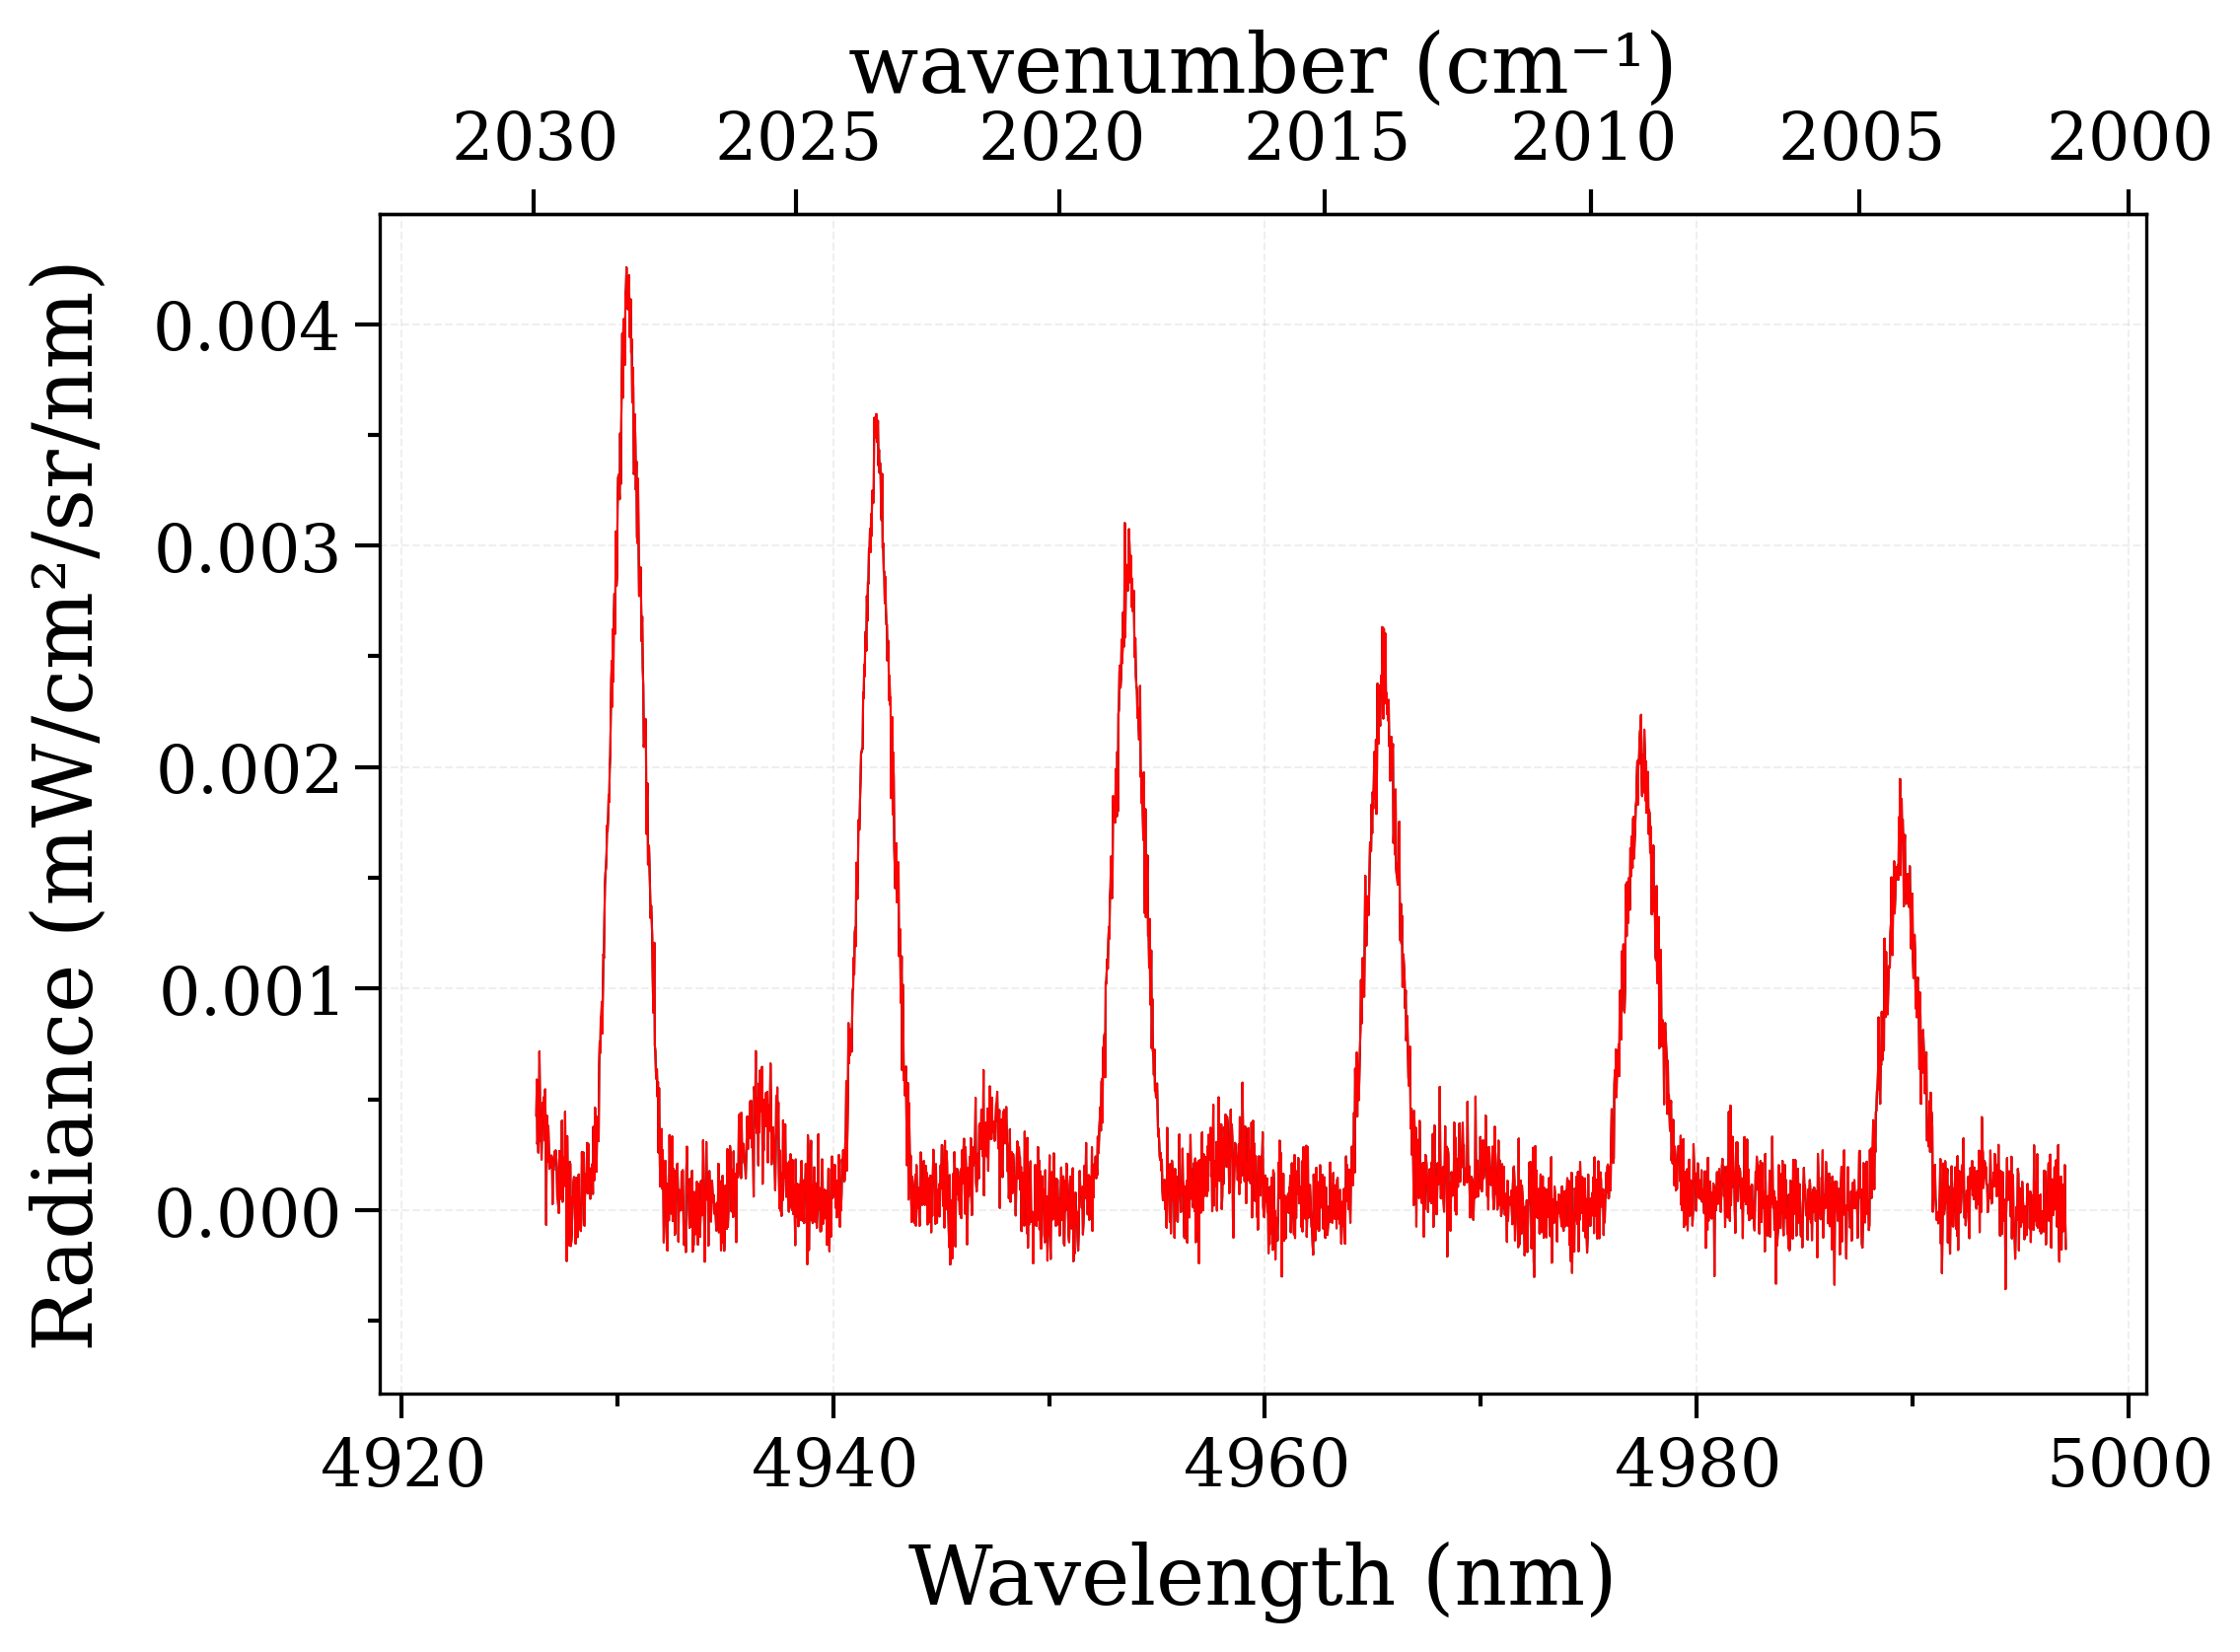
Note: we can also create a RADIS spectrum object from Specutils
specutils.spectra.spectrum1d.Spectrum1D :
from radis import Spectrum

s2 = Spectrum.from_specutils(spectrum)

s2.plot(Iunit="mW/cm2/sr/nm", wunit="nm")
s_exp.plot(Iunit="mW/cm2/sr/nm", wunit="nm", nfig="same")
assert s_exp == s2
Total running time of the script: (0 minutes 1.502 seconds)