


Note
Run this example online :
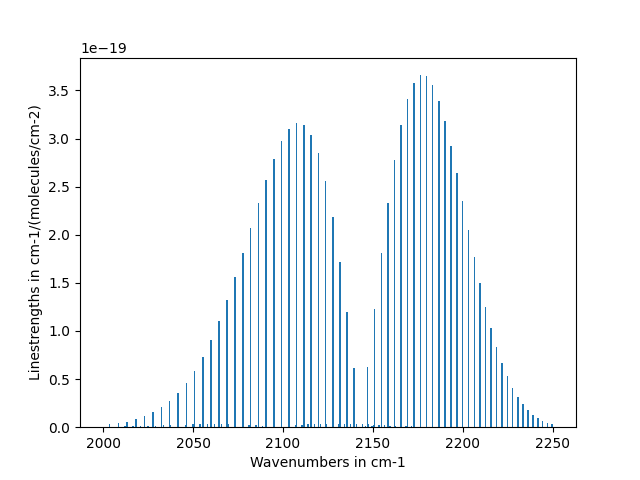
Scale Linestrengths of carbon-monoxide
This example scales the linestrengths of CO to Tgas=300 from Tref = 296 and then plots
the linestrengths against the wavenumbers. We are using fetch_hitemp()
function to retrieve the dataframe from the HITEMP-CO databank.
References
\[S(T) = S_0 \frac{Q_{ref}}{Q_{gas}} \operatorname{exp}\left(-E_l \left(\frac{1}{T_{gas}}-\frac{1}{T_{ref}}\right)\right) \frac{1-\operatorname{exp}\left(\frac{-\omega_0}{Tgas}\right)}{1-\operatorname{exp}\left(\frac{-\omega_0}{T_{ref}}\right)}\]
See Eq.(A11) in [Rothman-1998]
Similar functions are used directly at the hearth of RADIS’s SpectrumFactory in the
calc_linestrength_eq() and calc_linestrength_noneq() methods
Scaling equilibrium linestrength
from matplotlib import pyplot as plt
from numpy import exp

from radis.db.classes import get_molecule, get_molecule_identifier
from radis.io.hitemp import fetch_hitemp
from radis.levels.partfunc import PartFuncTIPS
from radis.phys.constants import hc_k


def get_Qgas(molecule, iso, T):

    M = get_molecule_identifier(molecule)

    Q = PartFuncTIPS(M, iso)
    return Q.at(T=T)


def scale_linestrength_eq(df, Tref, Tgas):

    print("Scaling equilibrium linestrength")

    # %% Load partition function values

    def _calc_Q(molecule, iso, T_ref, T_gas):

        Qref = get_Qgas(molecule, iso, T_ref)
        Qgas = get_Qgas(molecule, iso, T_gas)

        return Qref, Qgas

    id_set = df.id.unique()
    id = list(id_set)[0]
    molecule = get_molecule(id)  # retrieve the molecule
    iso_set = set(df.iso)  # df1.iso.unique()

    Qref_Qgas_ratio = {}

    for iso in iso_set:
        Qref, Qgas = _calc_Q(molecule, iso, Tref, Tgas)
        Qref_Qgas_ratio[iso] = Qref / Qgas

    # Scaling linestrength with the equations from Rotham's paper
    line_strength = df.int * df["iso"].map(Qref_Qgas_ratio)
    line_strength *= exp(-hc_k * df.El * (1 / Tgas - 1 / Tref))
    line_strength *= (1 - exp(-hc_k * df.wav / Tgas)) / (1 - exp(-hc_k * df.wav / Tref))
    # Add a fresh columns with the scaled linestrength
    df["S"] = line_strength  # [cm-1/(molecules/cm-2)]

    # Just to make sure linestrength is indeed added
    assert "S" in df

    return df


if __name__ == "__main__":
    Tref = 296
    df = fetch_hitemp(
        molecule="CO",
        isotope="1, 2, 3",
        load_wavenum_min=2000,
        load_wavenum_max=2250,
    )

    Tgas = 450

    df = scale_linestrength_eq(df, Tref, Tgas)
    plt.bar(df["wav"], df["S"])
    plt.xlabel("Wavenumbers in cm-1")
    plt.ylabel("Linestrengths in cm-1/(molecules/cm-2)")
    plt.show()
Total running time of the script: ( 0 minutes 5.720 seconds)