


Note
Run this example online :
Slit Function
Quickly load and plot a slit function with plot_slit()
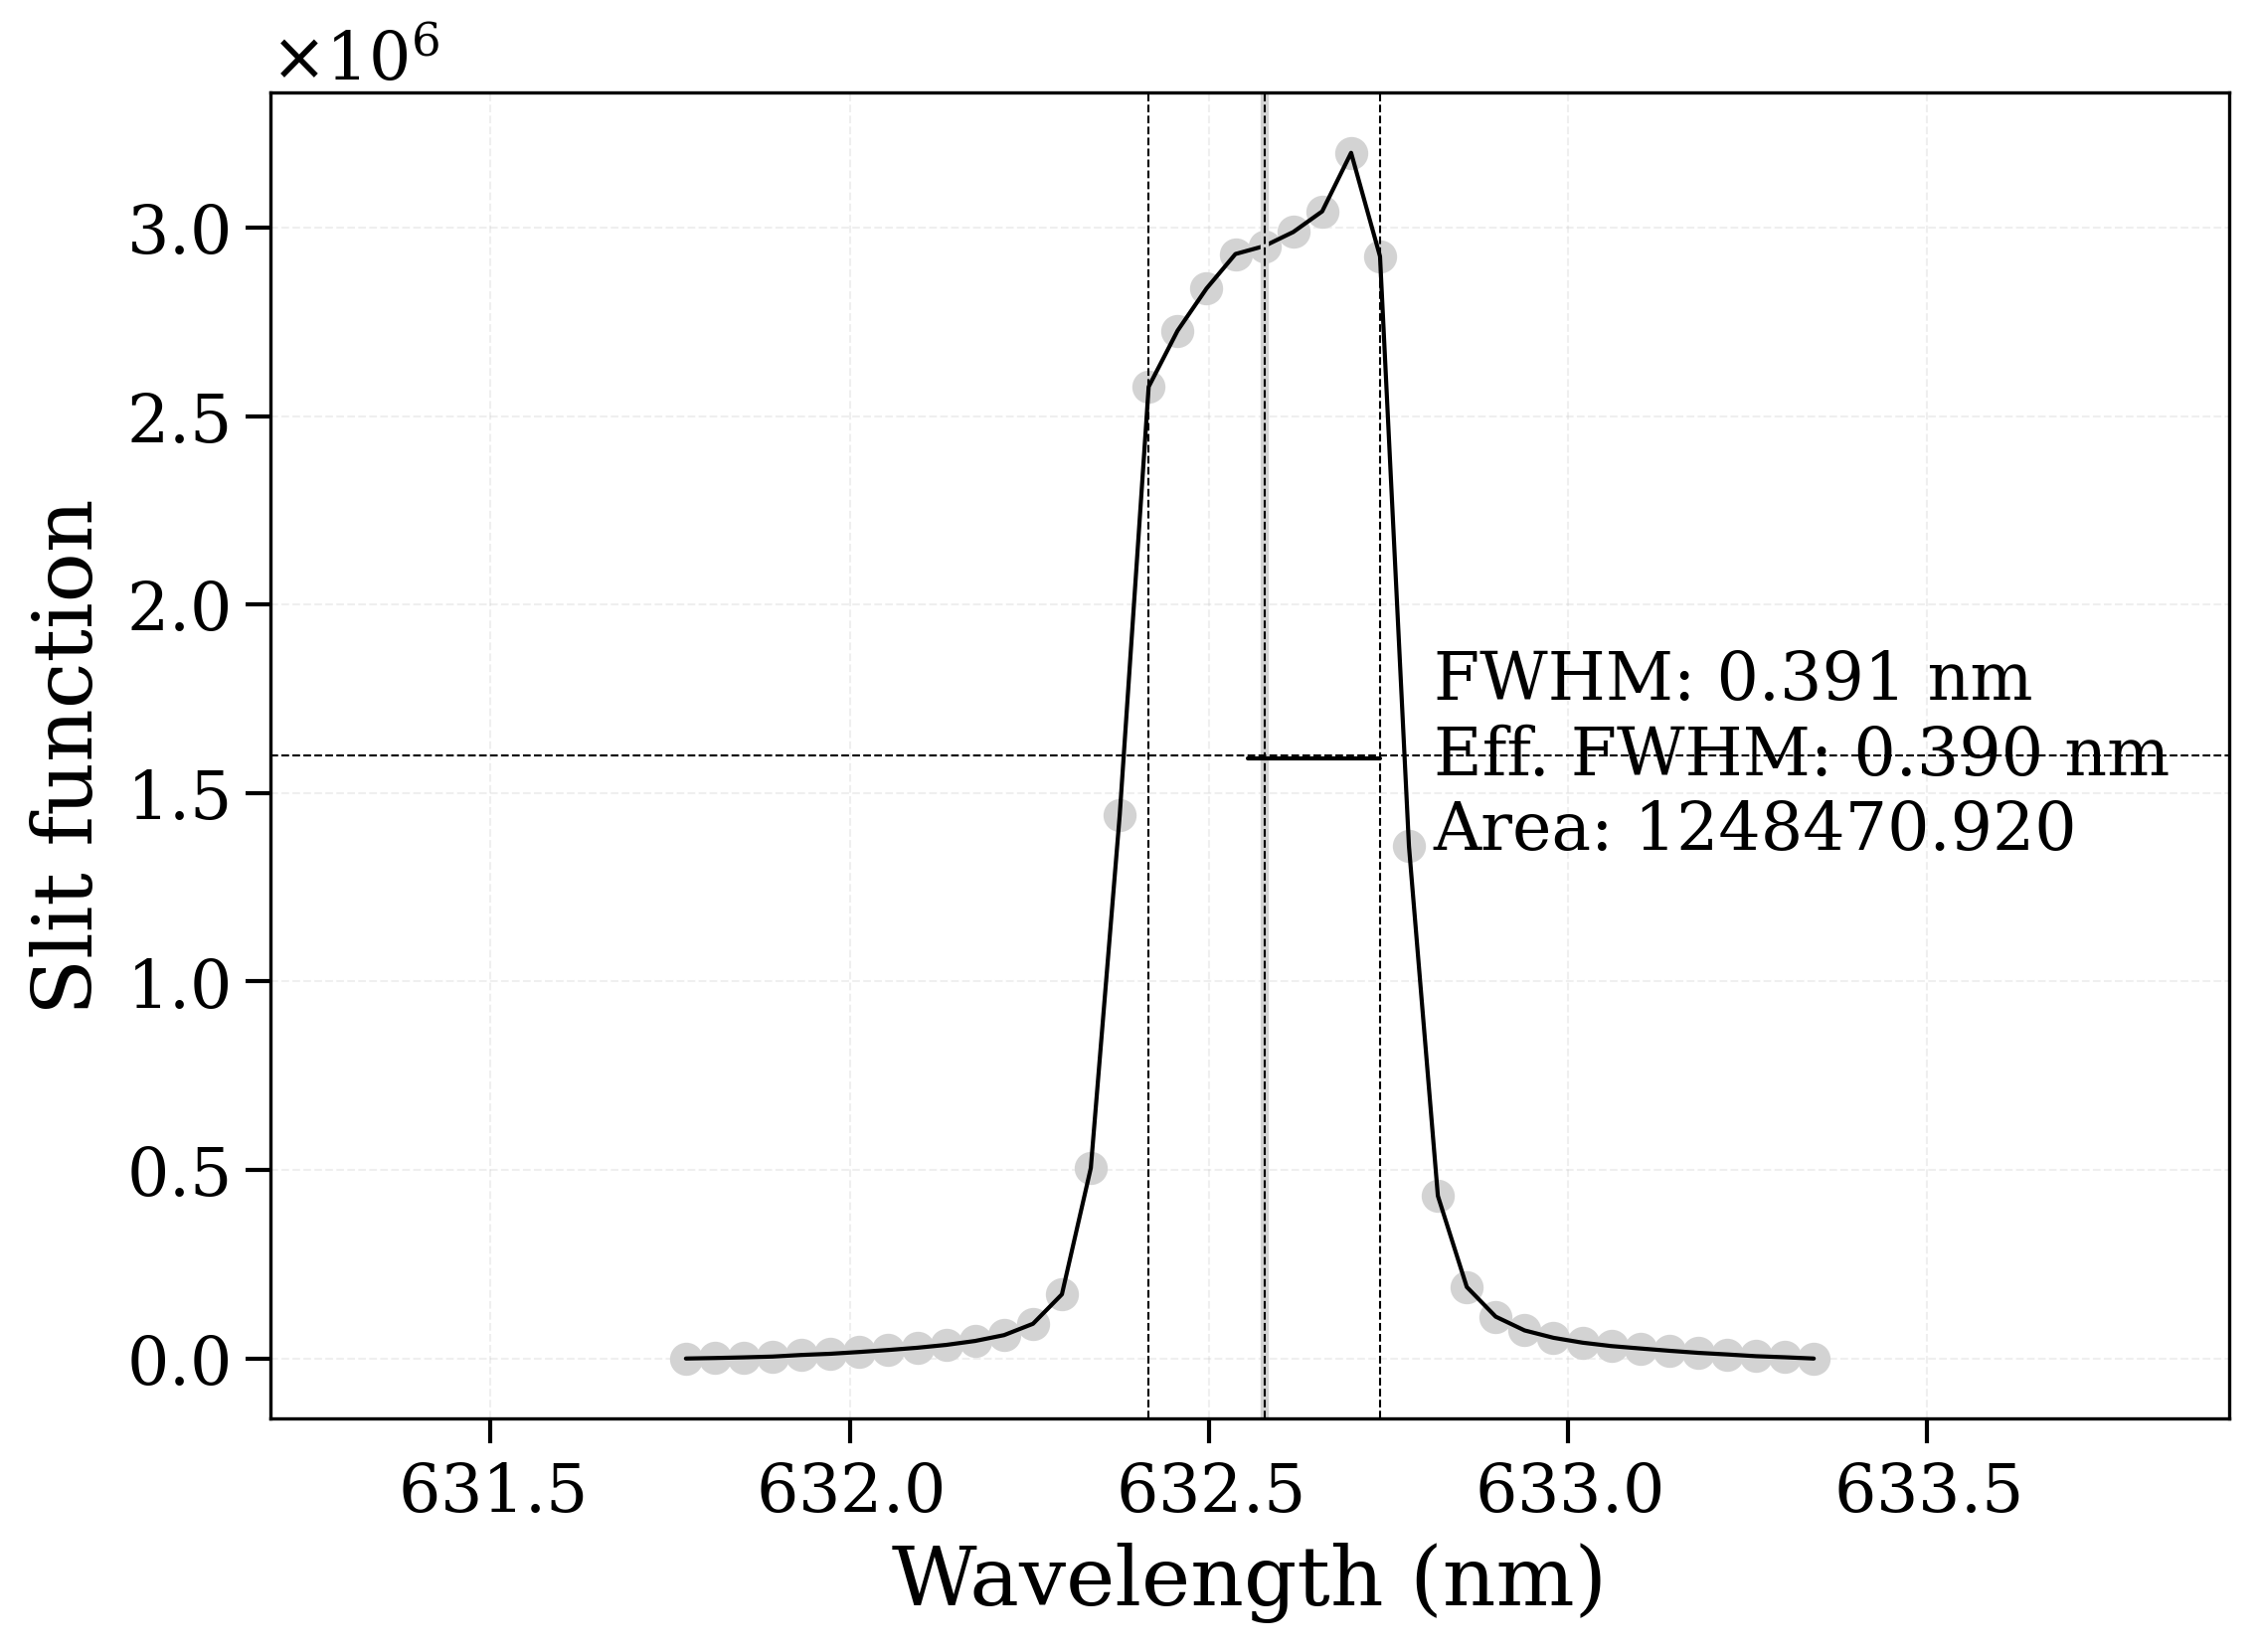
(<Figure size 640x480 with 1 Axes>, <AxesSubplot:xlabel='Wavelength (nm)', ylabel='Slit function'>)
from radis import plot_slit
from radis.test.utils import getTestFile

my_slit = getTestFile("slitfunction.txt")  # for the example here
plot_slit(my_slit, wunit="nm")
Total running time of the script: ( 0 minutes 1.144 seconds)