


Note
Run this example online :
Explore Line Database Parameters
Database will be downloaded automatically and can be edited locally.
The Download HITEMP Database example showed how to download the HITEMP database under Pandas format.
RADIS can also be used to explore and visualize larger databases, using the
underlying vaex library.
from radis.io.hitemp import fetch_hitemp

df = fetch_hitemp("CO2", output="vaex", load_wavenum_min=2150, load_wavenum_max=2450)
print(f"{len(df)} lines in HITEMP CO2; 2150 - 2450 cm-1")
HITEMP keep only relevant input files: ['/home/docs/.radisdb/hitemp/CO2-02_02125-02250_HITEMP2010.hdf5', '/home/docs/.radisdb/hitemp/CO2-02_02250-02500_HITEMP2010.hdf5']
HITEMP keep only relevant input files: ['/home/docs/.radisdb/hitemp/CO2-02_02125-02250_HITEMP2010.hdf5', '/home/docs/.radisdb/hitemp/CO2-02_02250-02500_HITEMP2010.hdf5']
Downloading 02_02125-02250_HITEMP2010.zip for CO2 (1/2).
Download complete. Parsing CO2 database to /home/docs/.radisdb/hitemp/CO2-02_02125-02250_HITEMP2010.hdf5

Downloading 02_02250-02500_HITEMP2010.zip for CO2 (2/2).
Download complete. Parsing CO2 database to /home/docs/.radisdb/hitemp/CO2-02_02250-02500_HITEMP2010.hdf5
Added HITEMP-CO2 database in /home/docs/radis.json
HITEMP keep only relevant input files: ['/home/docs/.radisdb/hitemp/CO2-02_02125-02250_HITEMP2010.hdf5', '/home/docs/.radisdb/hitemp/CO2-02_02250-02500_HITEMP2010.hdf5']
1355761 lines in HITEMP CO2; 2150 - 2450 cm-1
Note the use of output='vaex' in fetch_hitemp() above.
The returned DataFrame is a Vaex DataFrame.
Loading times takes only few tens of milliseconds even for the largest HITEMP or ExoMol
databases
We can also use Vaex graph functions. See Vaex vizualisations : https://vaex.readthedocs.io/en/latest/guides/advanced_plotting.html#
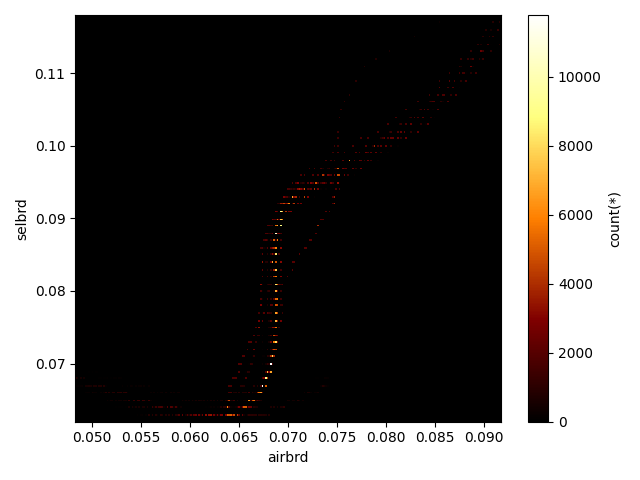
For instance, we plot a heatmap() showing Self and Air-broadening coefficients
import matplotlib.pyplot as plt

plt.figure()
df.viz.heatmap("airbrd", "selbrd", limits="99%")

# TODO / idea : compare CO2 broadening with Air broadening for HITRAN database ?
<matplotlib.image.AxesImage object at 0x7f846f24c220>
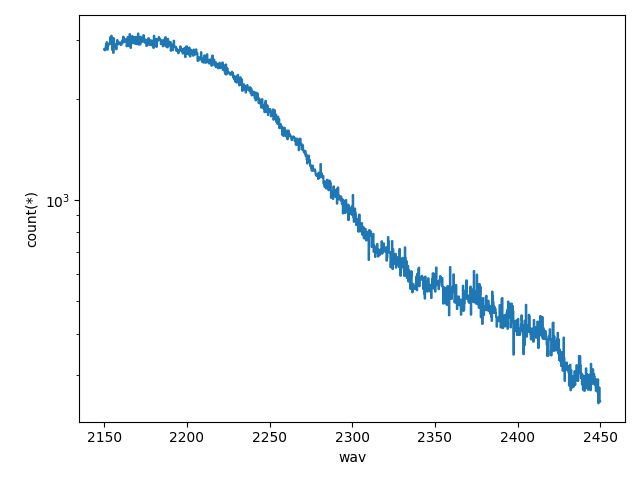
Or below we plot the number of lines using Vaex’s histogram()
plt.figure()
df.viz.histogram("wav", shape=1000)
plt.yscale("log")
Total running time of the script: ( 1 minutes 12.068 seconds)