


Note
Run this example online :
Post-process using Specutils
Find peaks or uncertainties using the specutils library. A Radis Spectrum
object can easily be converted to a specutils specutils.spectra.spectrum1d.Spectrum1D
using to_specutils().
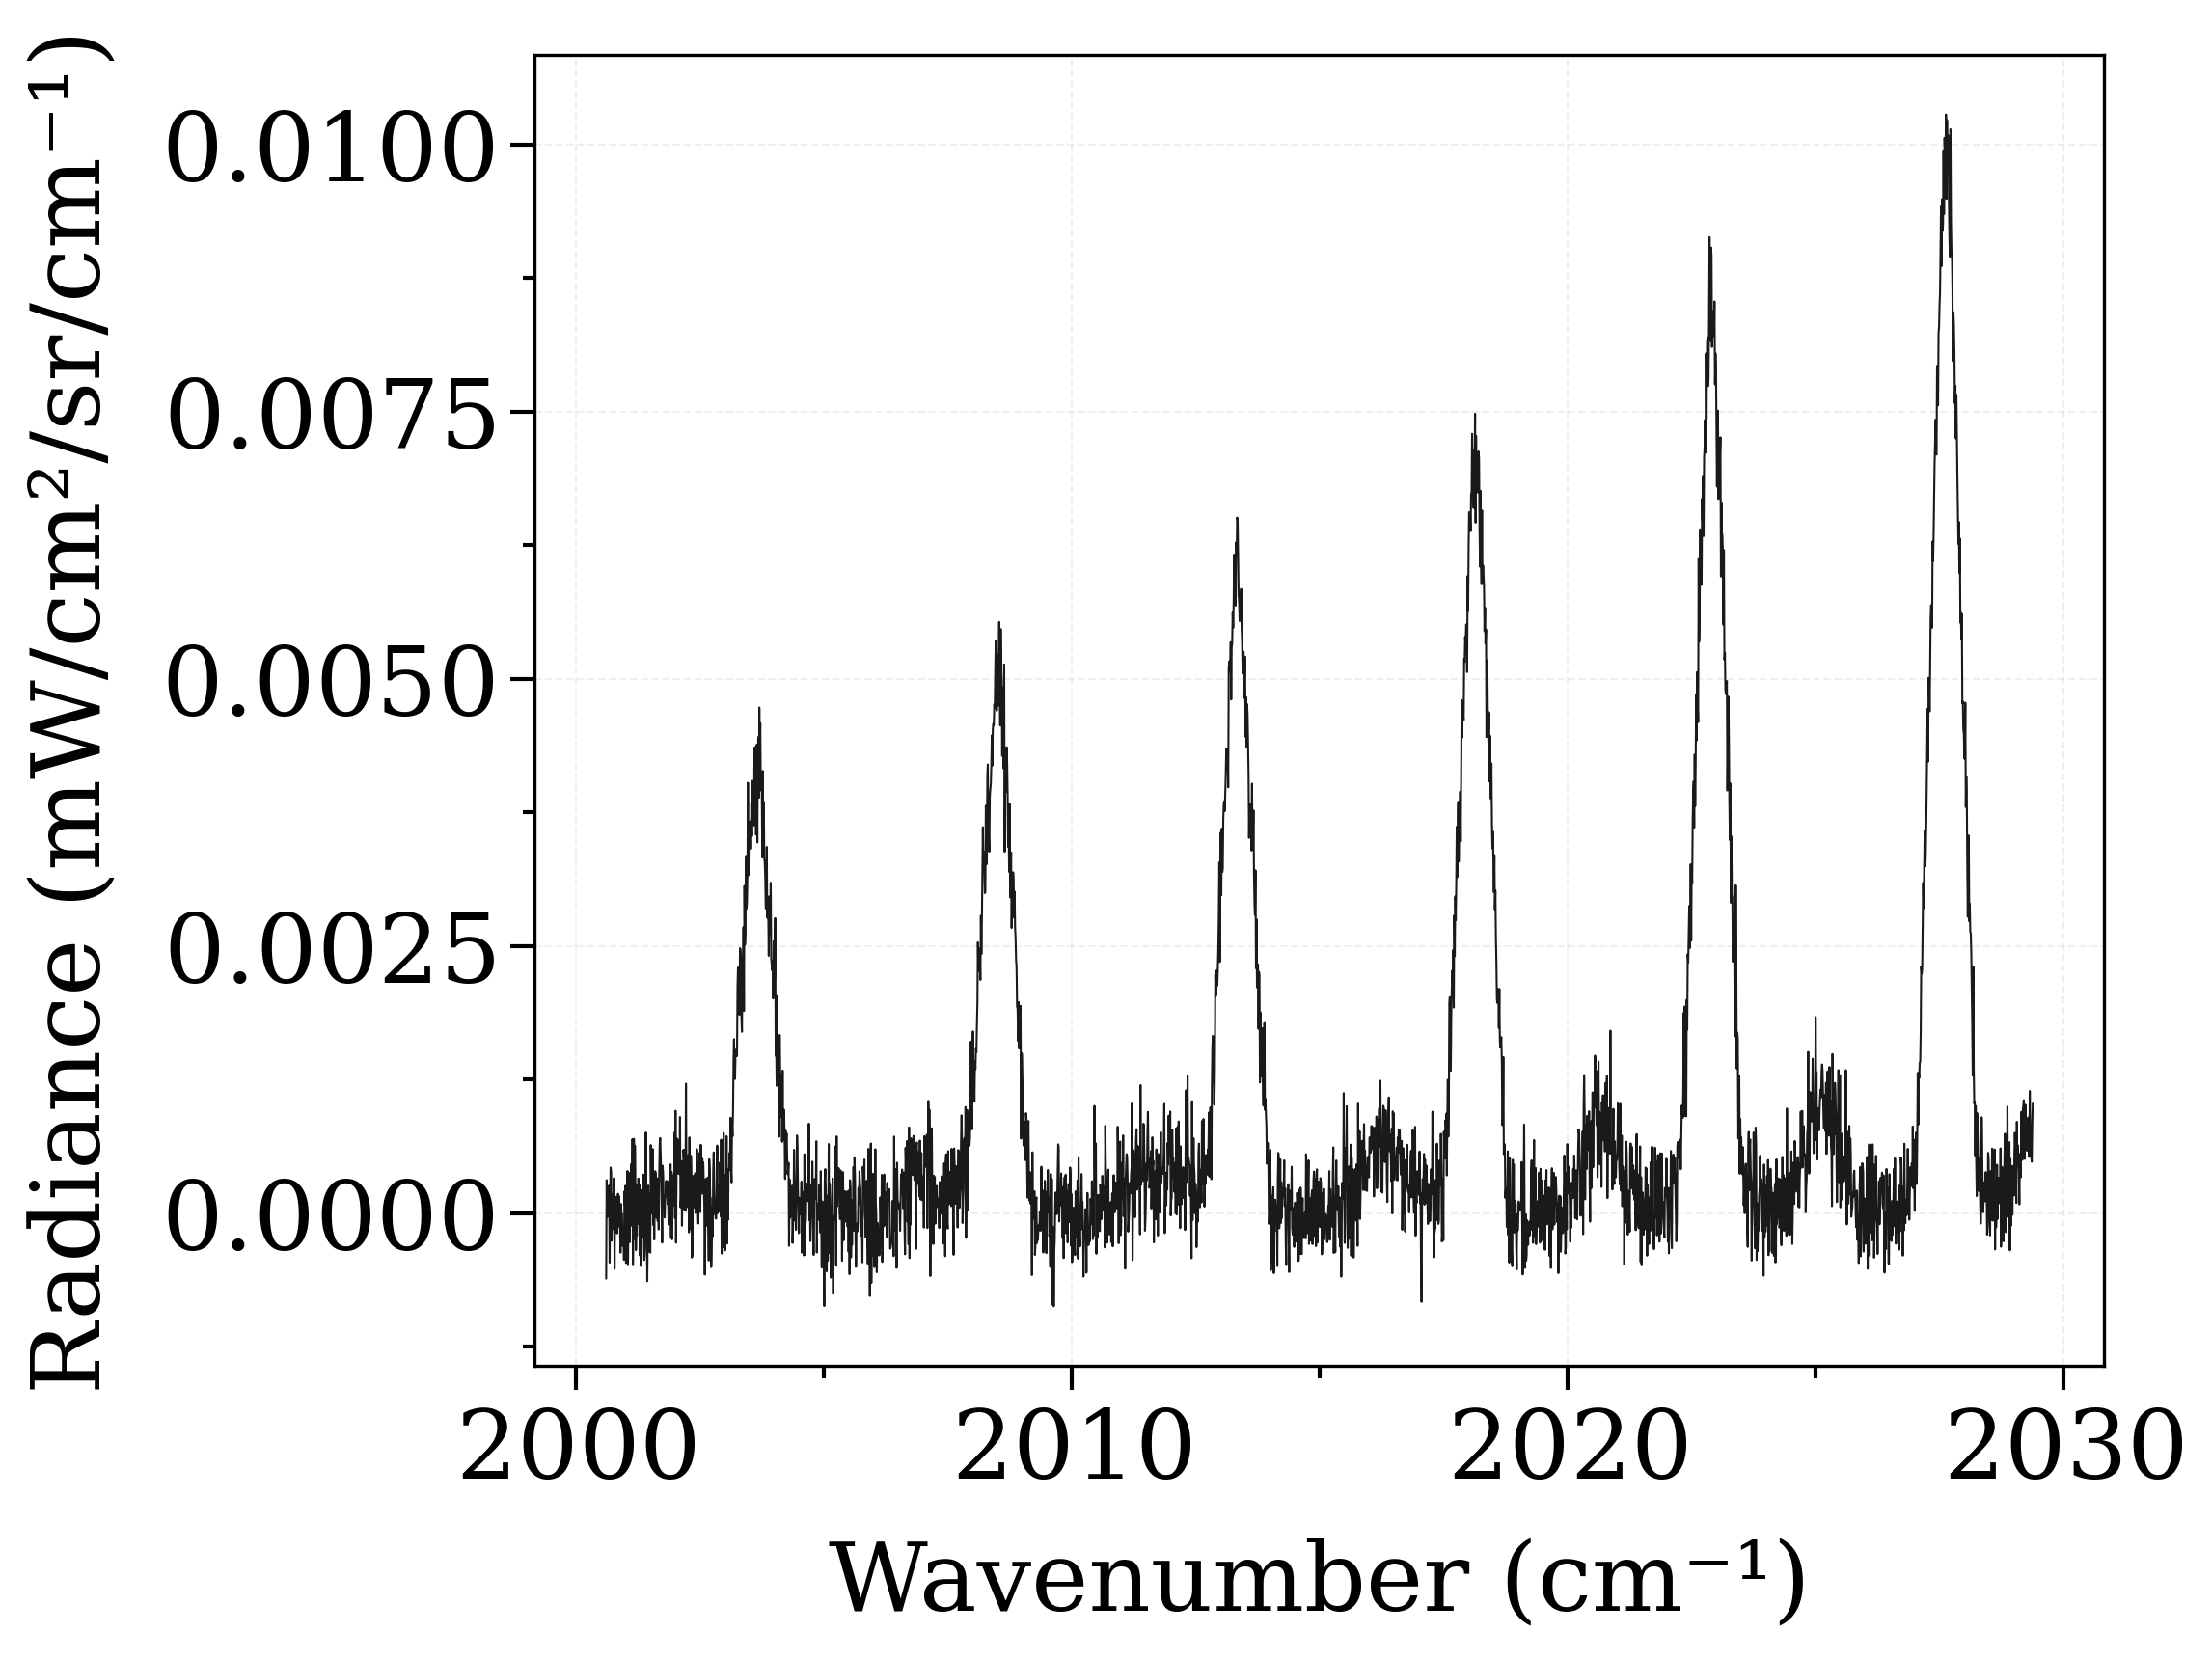
Below, we create a noisy spectrum based on a synthetic CO spectrum,
we convert it to specutils, add uncertainties by targeting a
noisy region, then determine the lines using find_lines_threshold() :
import astropy.units as u
import numpy as np

from radis import test_spectrum

""" We create a synthetic CO spectrum"""

s = (
    test_spectrum(molecule="CO", wavenum_min=2000, wavenum_max=2030)
    .apply_slit(1.5, "nm")
    .take("radiance")
)
s.trim()  # removes nans created by the slit convolution boundary effects
noise = np.random.normal(0.0, s.max().value * 0.03, len(s))
s_exp = s + noise

s_exp.plot()
Calculating Equilibrium Spectrum
Physical Conditions
----------------------------------------
   Tgas                 700 K
   Trot                 700 K
   Tvib                 700 K
   isotope              1,2,3
   mole_fraction        0.1
   molecule             CO
   overpopulation       None
   path_length          1 cm
   pressure_mbar        1013.25 mbar
   rot_distribution     boltzmann
   self_absorption      True
   state                X
   vib_distribution     boltzmann
   wavenum_max          2030.0000 cm-1
   wavenum_min          2000.0000 cm-1
Computation Parameters
----------------------------------------
   Tref                 296 K
   add_at_used
   broadening_method    voigt
   cutoff               1e-27 cm-1/(#.cm-2)
   dbformat             hitran
   dbpath               /home/docs/.radisdb/hitran/CO.hdf5
   folding_thresh       1e-06
   include_neighbouring_lines  True
   memory_mapping_engine  auto
   neighbour_lines      0 cm-1
   optimization         simple
   parfuncfmt           hapi
   parsum_mode          full summation
   pseudo_continuum_threshold  0
   sparse_ldm           auto
   truncation           50 cm-1
   waveunit             cm-1
   wstep                0.01 cm-1
   zero_padding         -1
----------------------------------------
0.03s - Spectrum calculated

<matplotlib.lines.Line2D object at 0x7f848b9cbd30>
Determine the noise level by selecting a noisy region from the graph above :
spectrum = s_exp.to_specutils()

from specutils import SpectralRegion
from specutils.manipulation import noise_region_uncertainty

noise_region = SpectralRegion(2010.5 / u.cm, 2009.5 / u.cm)
spectrum = noise_region_uncertainty(spectrum, noise_region)
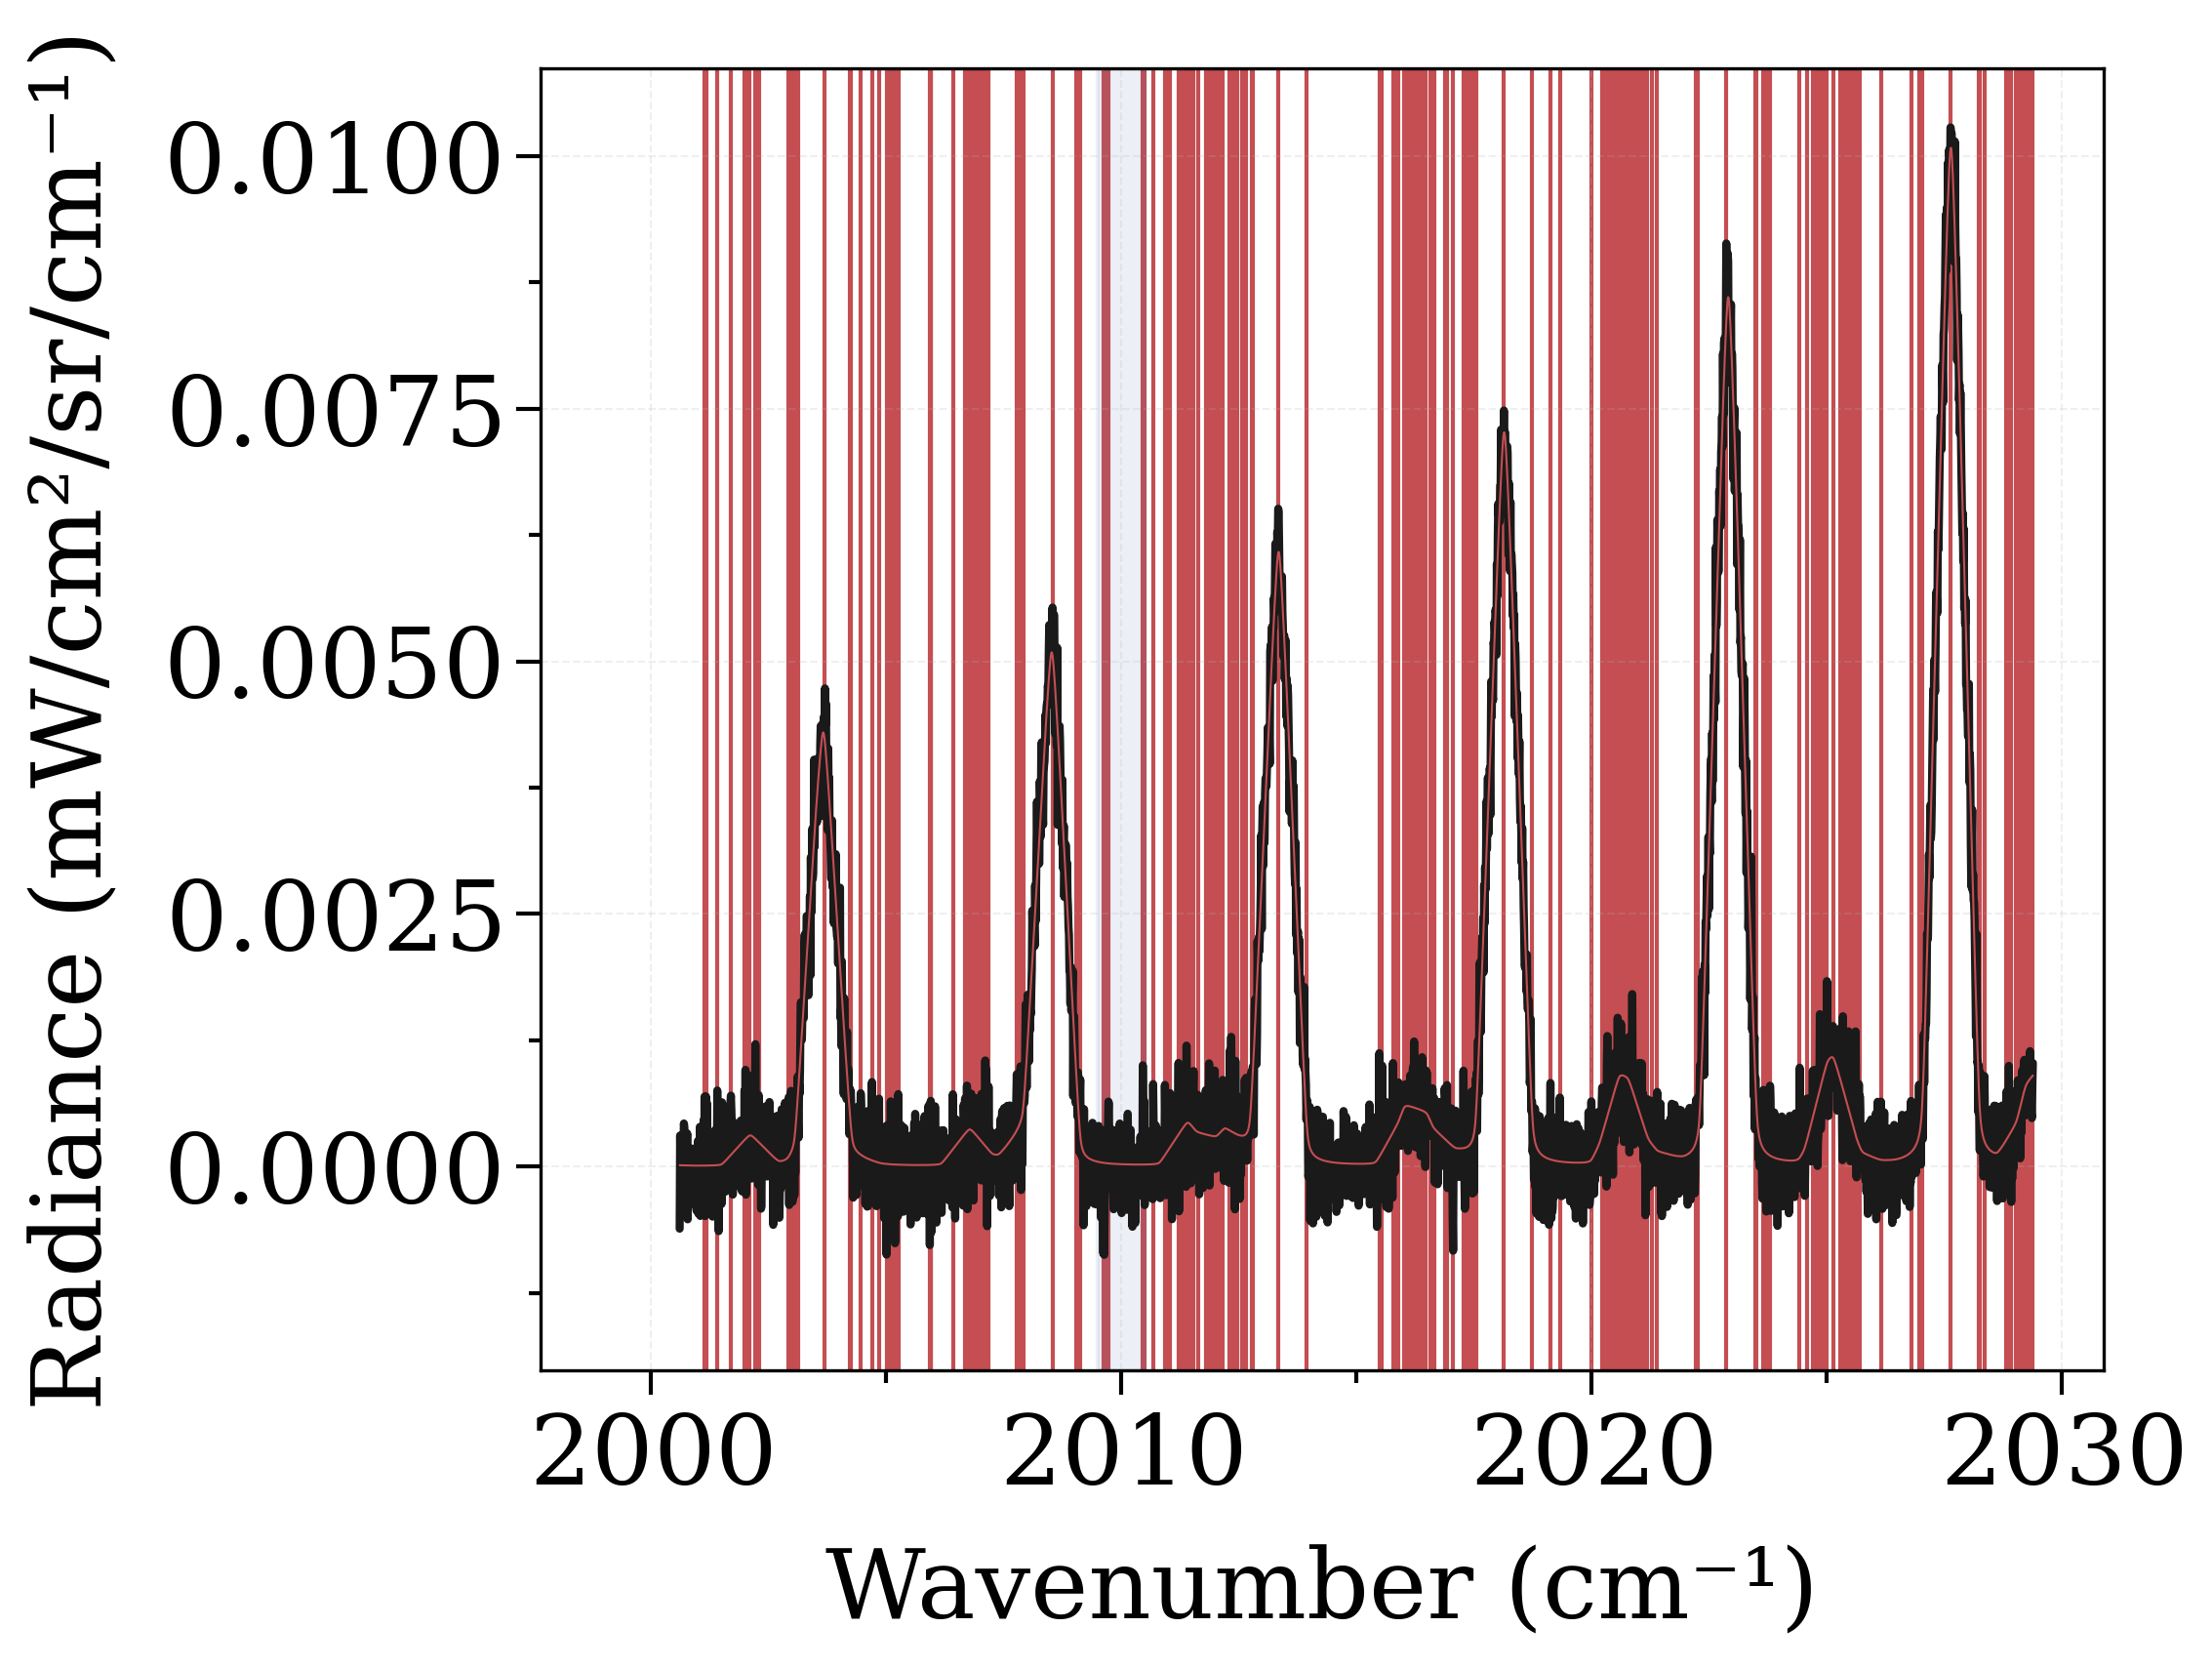
Find lines :
from specutils.fitting import find_lines_threshold

lines = find_lines_threshold(spectrum, noise_factor=2)

print(lines)


s_exp.plot(lw=2, show_ruler=True)
import matplotlib.pyplot as plt

for line in lines.to_pandas().line_center.values:
    plt.axvline(line, color="r", zorder=-1)
s.plot(nfig="same")
plt.axvspan(noise_region.lower.value, noise_region.upper.value, color="b", alpha=0.1)
/home/docs/checkouts/readthedocs.org/user_builds/radis/envs/master/lib/python3.8/site-packages/specutils/analysis/flux.py:290: AstropyUserWarning:

Spectrum is not below the threshold signal-to-noise 0.01. This may indicate you have not continuum subtracted this spectrum (or that you have but it has high SNR features).

If you want to suppress this warning either type 'specutils.conf.do_continuum_function_check = False' or see http://docs.astropy.org/en/stable/config/#adding-new-configuration-items for other ways to configure the warning.

   line_center     line_type  line_center_index
      1 / cm
------------------ ---------- -----------------
 2001.139999999999   emission                53
 2001.169999999999   emission                56
2001.4099999999987   emission                80
2001.6999999999985   emission               109
2001.9899999999982   emission               138
2002.0099999999982   emission               140
2002.0399999999981   emission               143
 2002.079999999998   emission               147
 2002.099999999998   emission               149
 2002.219999999998   emission               161
               ...        ...               ...
2029.2999999999734   emission              2869
2029.3299999999733   emission              2872
2029.3899999999733   emission              2878
2005.0099999999954 absorption               440
2005.1899999999953 absorption               458
2005.9299999999946 absorption               532
2005.9599999999946 absorption               535
2009.6199999999913 absorption               901
2009.6399999999912 absorption               903
2017.0599999999845 absorption              1645
Length = 194 rows
/home/docs/checkouts/readthedocs.org/user_builds/radis/envs/master/lib/python3.8/site-packages/radis/tools/plot_tools.py:599: UserWarning:

Couldn't add Ruler tool (still an experimental feature in RADIS : please report the error !)


<matplotlib.patches.Polygon object at 0x7f8467c16100>
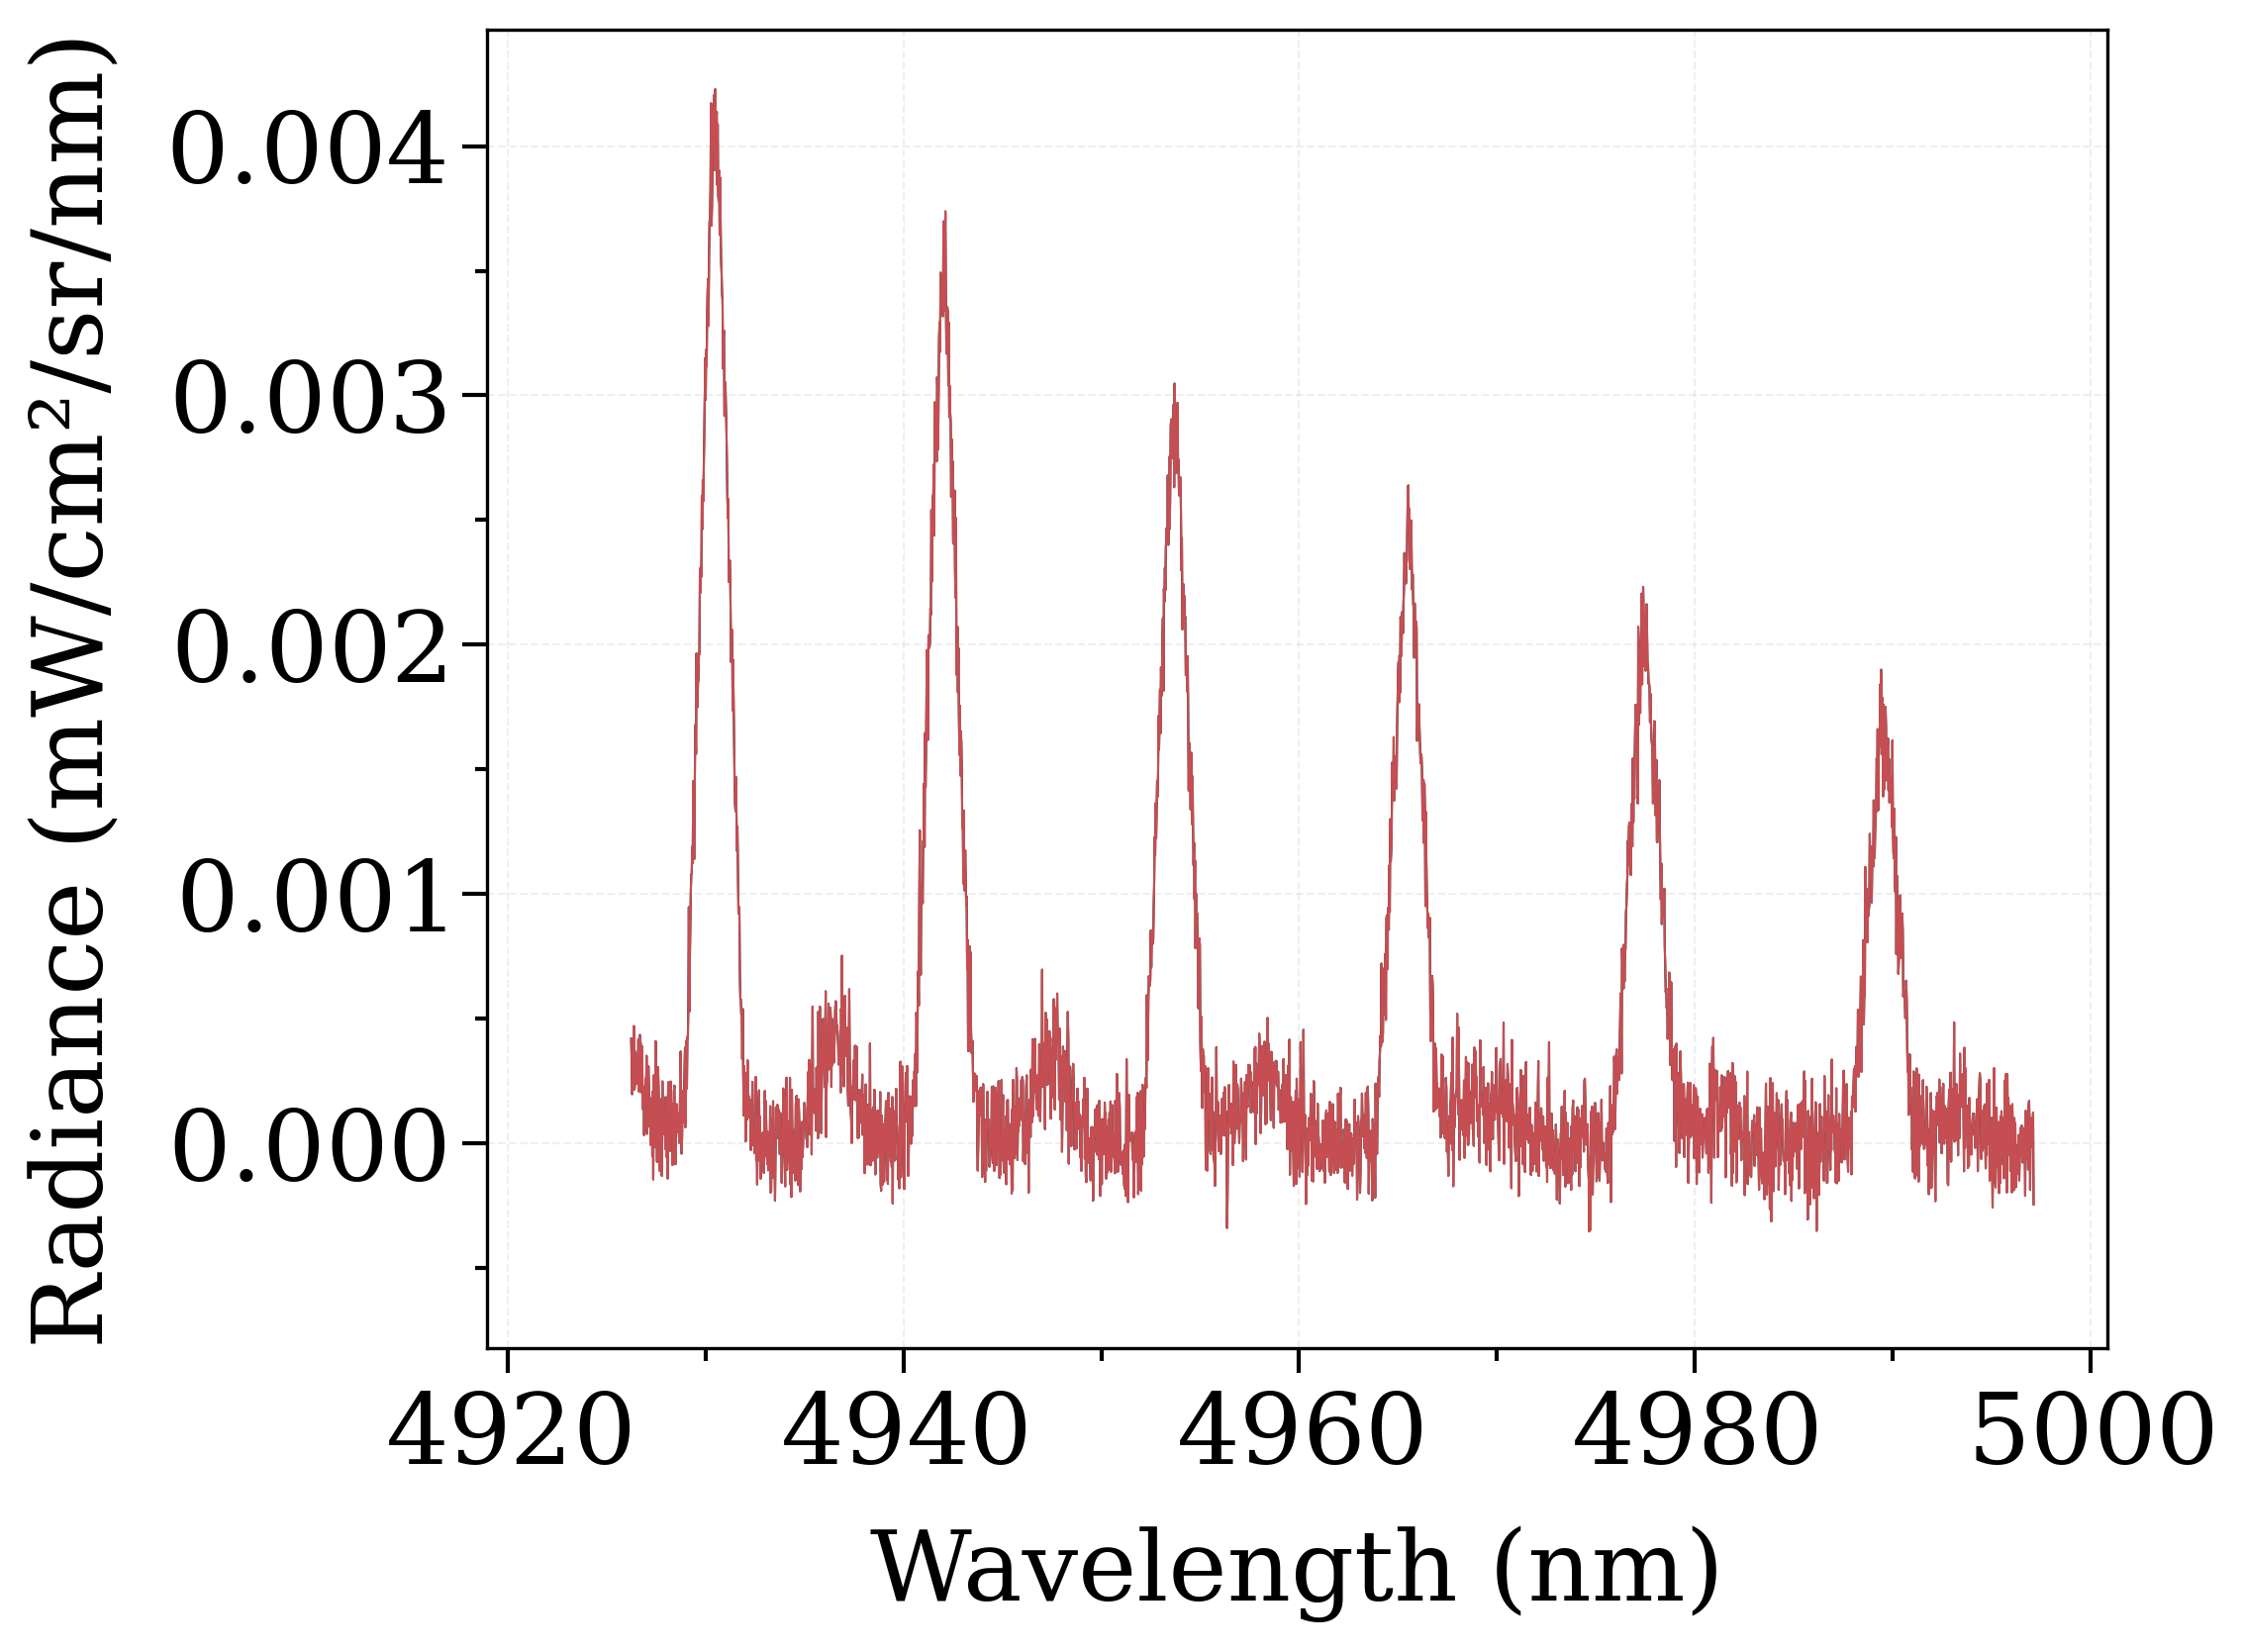
Note: we can also create a RADIS spectrum object from Specutils
specutils.spectra.spectrum1d.Spectrum1D :
from radis import Spectrum

s2 = Spectrum.from_specutils(spectrum)

s2.plot(Iunit="mW/cm2/sr/nm", wunit="nm")
s_exp.plot(Iunit="mW/cm2/sr/nm", wunit="nm", nfig="same")
assert s_exp == s2
Total running time of the script: ( 0 minutes 3.881 seconds)