


Note
Run this example online :
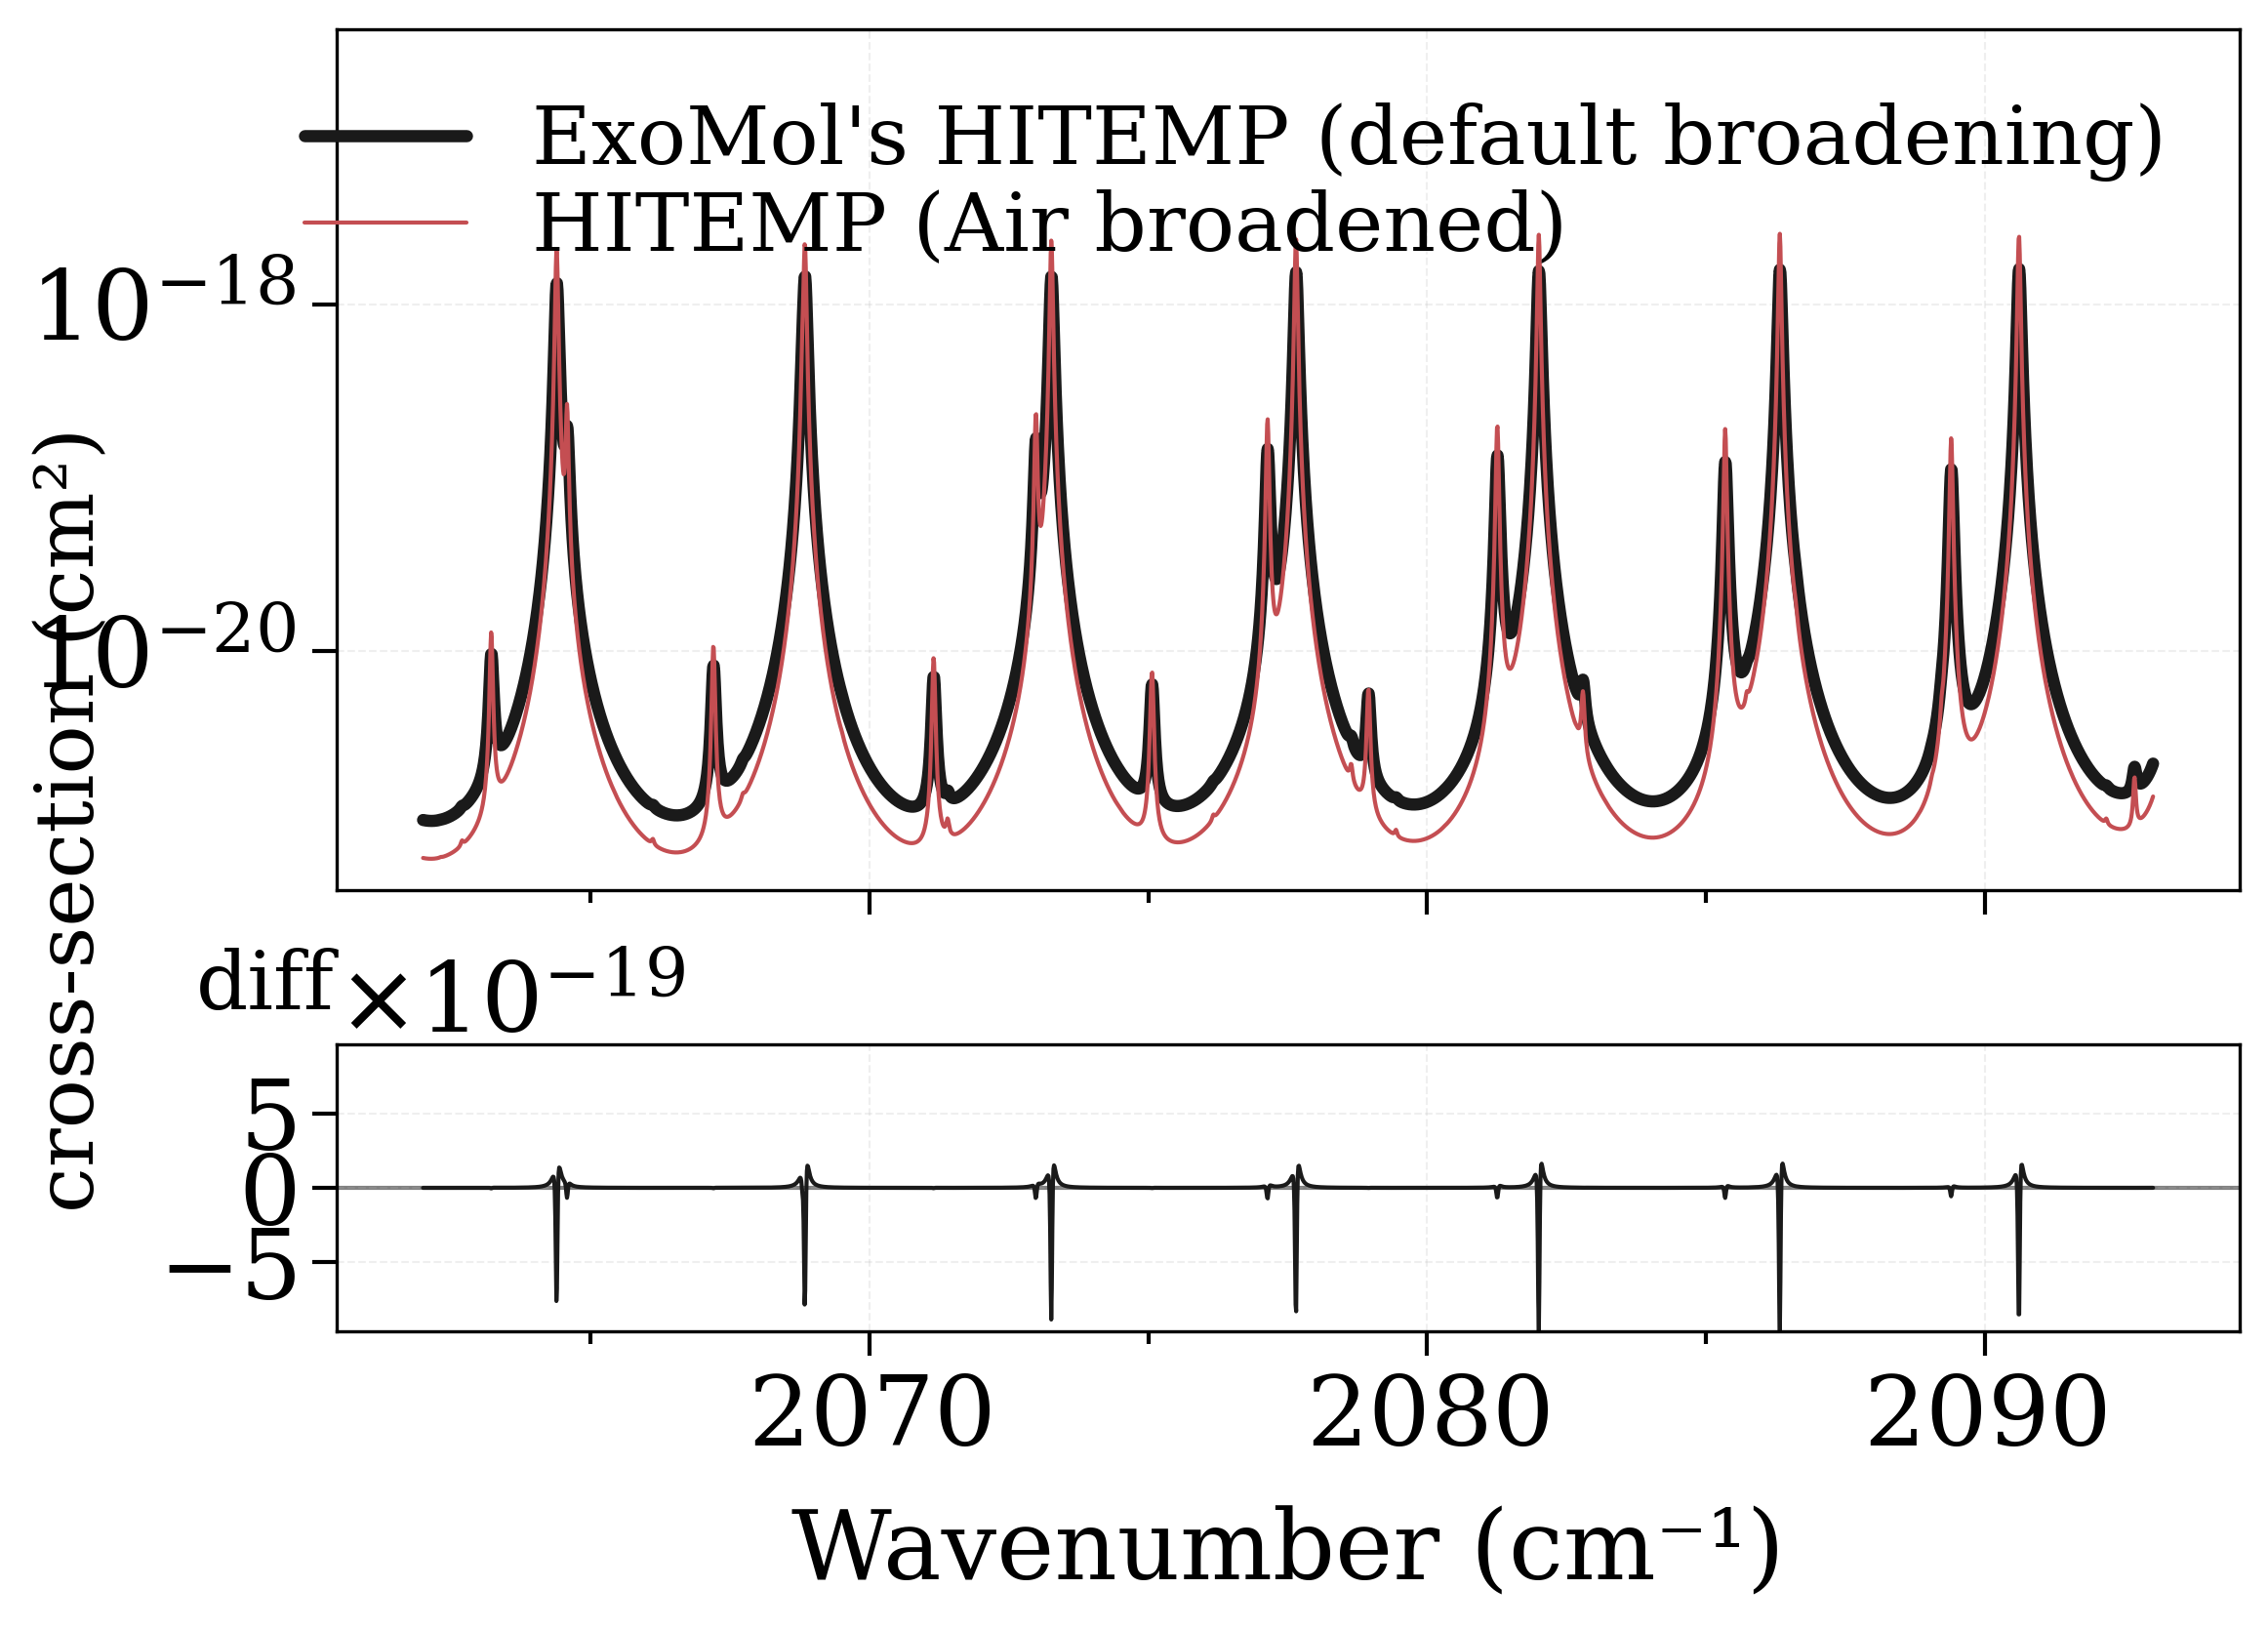
Compare CO xsections from the ExoMol and HITEMP database
Auto-download and calculate CO spectrum from the HITEMP database, and the
ExoMol database. ExoMol references multiple databases for CO. Here we do not
use the ExoMol recommended database (see get_exomol_database_list())
but we use the HITEMP database hosted on ExoMol.
Output should be similar, but no ! By default these two databases provide different broadening coefficients. However, the Einstein coefficients & linestrengths should be the same, therefore the integrals under the lines should be similar.
We verifiy this below :
For further exploration, ExoMol and HITEMP lines can be downloaded and accessed separately using
fetch_exomol() and fetch_hitemp()
import astropy.units as u

from radis import calc_spectrum, plot_diff

conditions = {
    "wmin": 2062 / u.cm,
    "wmax": 2093 / u.cm,
    "molecule": "CO",
    "isotope": "1",
    "pressure": 1.01325,  # bar
    "Tgas": 1000,  # K
    "mole_fraction": 0.1,
    "path_length": 1,  # cm
    "broadening_method": "fft",  # @ dev: Doesn't work with 'voigt'
    "verbose": True,
    "neighbour_lines": 20,
}
Note that we account for the effect on neighbour_lines by computing 20cm-1
on the side (neighbour_lines condition above)
s_exomol = calc_spectrum(
    **conditions, databank="exomol", name="ExoMol's HITEMP (default broadening)"
)
s_hitemp = calc_spectrum(
    **conditions,
    databank="hitemp",
    name="HITEMP (Air broadened)",
)
fig, [ax0, ax1] = plot_diff(s_exomol, s_hitemp, "xsection", yscale="log")
# Adjust diff plot to be in linear scale
ax1.set_yscale("linear")
ax0.set_ylim(ymax=ax0.get_ylim()[1] * 10)  # more space for legend
Using ExoMol database Li2015 for 12C-16O (recommended by the ExoMol team). All available databases are ['HITEMP', 'Li', 'xsec-Li2015', 'xsec-VUV-DTU', 'Li2015']. Select one of them with `radis.fetch_exomol(DATABASE_NAME)`, `SpectrumFactory.fetch_databank('exomol', exomol_database=DATABASE_NAME')`, or `calc_spectrum(..., databank=('exomol', DATABASE_NAME))`

Background atmosphere:  Air
Downloading http://www.exomol.com/db/CO/12C-16O/Li2015/12C-16O__Li2015.def
Downloading http://www.exomol.com/db/CO/12C-16O/Li2015/12C-16O__Li2015.pf
Downloading http://www.exomol.com/db/CO/12C-16O/Li2015/12C-16O__Li2015.states.bz2
Downloading http://www.exomol.com/db/CO/12C-16O/12C-16O__H2.broad
Downloading http://www.exomol.com/db/CO/12C-16O/12C-16O__He.broad
Downloading http://www.exomol.com/db/CO/12C-16O/12C-16O__air.broad
Error: Couldn't download .broad file at http://www.exomol.com/db/CO/12C-16O/12C-16O__air.broad and save.
Note: Caching states data to the vaex format. After the second time, it will become much faster.
Reading transition file
Downloading http://www.exomol.com/db/CO/12C-16O/Li2015/12C-16O__Li2015.trans.bz2
Note: Caching line transition data to the vaex format. After the second time, it will become much faster.
.broad is used.
Warning: Cannot load .broad. The default broadening parameters are used.
Calculating Equilibrium Spectrum
Physical Conditions
----------------------------------------
   Tgas                 1000 K
   Trot                 1000 K
   Tvib                 1000 K
   isotope              1
   mole_fraction        0.1
   molecule             CO
   overpopulation       None
   path_length          1 cm
   pressure_mbar        1013.25 mbar
   rot_distribution     boltzmann
   self_absorption      True
   state                X
   vib_distribution     boltzmann
   wavenum_max          2093.0000 cm-1
   wavenum_min          2062.0000 cm-1
Computation Parameters
----------------------------------------
   Tref                 296 K
   add_at_used
   broadening_method    fft
   cutoff               1e-27 cm-1/(#.cm-2)
   dbformat             exomol-radisdb
   dbpath               /home/docs/.radisdb/exomol/CO/12C-16O/Li2015
   folding_thresh       1e-06
   include_neighbouring_lines  True
   memory_mapping_engine  auto
   neighbour_lines      20 cm-1
   optimization         simple
   parfuncfmt           exomol
   parsum_mode          full summation
   pseudo_continuum_threshold  0
   sparse_ldm           auto
   truncation           None cm-1
   waveunit             cm-1
   wstep                0.01 cm-1
   zero_padding         -1
----------------------------------------
/home/docs/checkouts/readthedocs.org/user_builds/radis/envs/master/lib/python3.8/site-packages/radis/misc/warning.py:354: MissingPressureShiftWarning:

Pressure-shift coefficient not given in database: assumed 0 pressure shift

0.02s - Spectrum calculated
Calculating Equilibrium Spectrum
Physical Conditions
----------------------------------------
   Tgas                 1000 K
   Trot                 1000 K
   Tvib                 1000 K
   isotope              1
   mole_fraction        0.1
   molecule             CO
   overpopulation       None
   path_length          1 cm
   pressure_mbar        1013.25 mbar
   rot_distribution     boltzmann
   self_absorption      True
   state                X
   vib_distribution     boltzmann
   wavenum_max          2093.0000 cm-1
   wavenum_min          2062.0000 cm-1
Computation Parameters
----------------------------------------
   Tref                 296 K
   add_at_used
   broadening_method    fft
   cutoff               1e-27 cm-1/(#.cm-2)
   dbformat             hitemp-radisdb
   dbpath               /home/docs/.radisdb/hitemp/CO-05_HITEMP2019.hdf5
   folding_thresh       1e-06
   include_neighbouring_lines  True
   memory_mapping_engine  auto
   neighbour_lines      20 cm-1
   optimization         simple
   parfuncfmt           hapi
   parsum_mode          full summation
   pseudo_continuum_threshold  0
   sparse_ldm           auto
   truncation           None cm-1
   waveunit             cm-1
   wstep                0.01 cm-1
   zero_padding         -1
----------------------------------------
0.02s - Spectrum calculated

(4.1789321827835834e-22, 3.8605771326502384e-17)
Broadening coefficients are different in these databases, so lineshapes end up being very different; however the areas under the lines should be the same. We verify this :
import numpy as np

try:
    assert np.isclose(
        s_exomol.get_integral("xsection"), s_hitemp.get_integral("xsection"), rtol=0.001
    )

except:
    # @dev: someone there is un expected error with this example on ReadThedocs.
    # Escaping for the moment. See https://github.com/radis/radis/issues/501
    pass
Total running time of the script: ( 0 minutes 7.079 seconds)