radis.io.exomol module
Molecular database (MDB) class
MdbExomol is the MDB for ExoMol
Initial code borrowed from the Exojax code (which you should also have a look at !), by @HajimeKawahara, under MIT License.
- class MdbExomol(path, molecule, database=None, local_databases=None, name='EXOMOL-{molecule}', nurange=[0.0, inf], margin=1.0, crit=-inf, bkgdatm='Air', broadf=True, engine='vaex', verbose=True, cache=True, skip_optional_data=True)[source]
Bases:
DatabaseManagermolecular database of ExoMol
MdbExomol is a class for ExoMol.
- Parameters
path (str) – path for Exomol data directory/tag. For instance, “/home/CO/12C-16O/Li2015”
nurange (array) – wavenumber range list (cm-1) or wavenumber array
margin (float) – margin for nurange (cm-1)
crit (float) – line strength lower limit for extraction
bkgdatm (str) – background atmosphere for broadening. e.g. H2, He,
broadf (bool) – if False, the default broadening parameters in .def file is used
- Other Parameters
engine (str) – which memory mapping engine to use : ‘vaex’, ‘pytables’ (HDF5), ‘feather’
skip_optional_data (bool) – If False, fetch all fields which are marked as available in the ExoMol definition file. If True, load only the first 4 columns of the states file (“i”, “E”, “g”, “J”). The structure of the columns above 5 depend on the the definitions file (*.def) and the Exomol version. If
skip_optional_data=False, two errors may occur:a field is marked as present/absent in the *.def field but is absent/present in the *.states file (ie both files are inconsistent).
in the updated version of Exomol, new fields have been added in the states file of some species. But it has not been done for all species, so both structures exist. For instance, the states file of https://exomol.com/data/molecules/HCl/1H-35Cl/HITRAN-HCl/ follows the structure described in [1]_, unlike the states file of https://exomol.com/data/molecules/NO/14N-16O/XABC/ which follows the structure described in [2]_.
Notes
The trans/states files can be very large. For the first time to read it, we convert it to the feather or hdf5-format. After the second-time, we use the feather/hdf5 format instead.
Examples
# Init database, download files if needed.
mdb = MdbExomol(
    local_path,
    molecule=molecule,
    name=databank_name,
    local_databases=local_databases,
    # nurange=[load_wavenum_min, load_wavenum_max],
    engine="vaex",
)

# Get cache files to load :
mgr = mdb.get_datafile_manager()
local_files = [mgr.cache_file(f) for f in mdb.trans_file]

# Load files
df = mdb.load(
    local_files,
    columns=columns_exomol,
    lower_bound=([('nu_lines', load_wavenum_min)] if load_wavenum_min else []) + ([("Sij0", mdb.crit)] if not np.isneginf(mdb.crit) else []),
    upper_bound=([('nu_lines', load_wavenum_max)] if load_wavenum_max else []),
    output="jax", # or "pytables", "vaex"
)

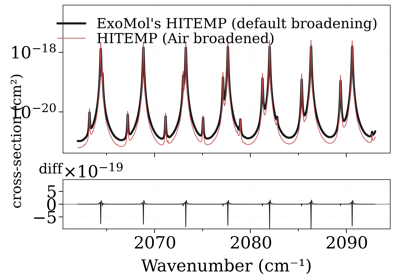
Compare CO xsections from the ExoMol and HITEMP database
Compare CO xsections from the ExoMol and HITEMP databasenu_lines (nd array): line center (cm-1) Sij0 (nd array): line strength at T=Tref (cm) dev_nu_lines (np array): line center in device (cm-1) logsij0 (np array): log line strength at T=Tref A (np array): Einstein A coefficient elower (np array): the lower state energy (cm-1) gpp (np array): statistical weight jlower (np array): J_lower jupper (np array): J_upper n_Tref (np array): temperature exponent alpha_ref (np array): alpha_ref (gamma0) n_Tref_def: default temperature exponent in .def file, used for jlower not given in .broad alpha_ref_def: default alpha_ref (gamma0) in .def file, used for jlower not given in .broad
References
- 1
Tennyson, J., Yurchenko, S. N., Al-Refaie, A. F., Barton, E. J., Chubb, K. L., Coles, P. A., … Zak, E. (2016). The ExoMol database: molecular line lists for exoplanet and other hot atmospheres. https://doi.org/10.1016/j.jms.2016.05.002
- 2
Tennyson, J., Yurchenko, S. N., Al-Refaie, A. F., Clark, V. H. J., Chubb, K. L., Conway, E. K., … Yurchenko, O. P. (2020). The 2020 release of the ExoMol database: Molecular line lists for exoplanet and other hot atmospheres. Journal of Quantitative Spectroscopy and Radiative Transfer, 255, 107228. https://doi.org/10.1016/j.jqsrt.2020.107228
- QT_interp(T)[source]
interpolated partition function
- Parameters
T (temperature)
- Return type
Q(T) interpolated in jnp.array
- download(molec, extension, numtag=None)[source]
Downloading Exomol files
- Parameters
molec (like “12C-16O__Li2015”)
extension (extension list e.g. [“.pf”,”.def”,”.trans.bz2”,”.states.bz2”,”.broad”])
numtag (number tag of transition file if exists. e.g. “11100-11200”)
Notes
The download URL is written in exojax.utils.url.
- qr_interp(T)[source]
interpolated partition function ratio
- Parameters
T (temperature)
- Return type
qr(T)=Q(T)/Q(Tref) interpolated in jnp.array
- set_broadening(df, alpha_ref_def=None, n_Texp_def=None, output=None)[source]
setting broadening parameters
- Parameters
alpha_ref (set default alpha_ref and apply it. None=use self.alpha_ref_def)
n_Texp_def (set default n_Texp and apply it. None=use self.n_Texp_def)
- Return type
None. Updates
dfwithalpha_ref,n_Texp_def
- to_partition_function_tabulator()[source]
Generate a
PartFuncExoMolobject
- fetch_exomol(molecule, database=None, local_databases=None, databank_name='EXOMOL-{molecule}', isotope='1', load_wavenum_min=None, load_wavenum_max=None, columns=None, cache=True, verbose=True, clean_cache_files=True, return_local_path=False, return_partition_function=False, engine='default', output='pandas', skip_optional_data=True)[source]
Stream ExoMol file from EXOMOL website. Unzip and build a HDF5 file directly.
Returns a Pandas DataFrame containing all lines.
- Parameters
molecule (
str) – ExoMol moleculedatabase (
str) – database name. Ex::POKAZATELorBT2forH2O. SeeKNOWN_EXOMOL_DATABASE_NAMES. IfNoneand there is only one database available, use it.local_databases (
str) – where to create the RADIS HDF5 files. Default"~/.radisdb/exomol". Can be changed inradis.config["DEFAULT_DOWNLOAD_PATH"]or in ~/radis.json config filedatabank_name (
str) – name of the databank in RADIS Configuration file Default"EXOMOL-{molecule}"isotope (
strorint) – load only certain isotopes, sorted by terrestrial abundances :'1','2', etc. Default1.Note
In RADIS, isotope abundance is included in the line intensity calculation. However, the terrestrial abundances used may not be relevant to non-terrestrial applications. By default, the abundance is given reading HITRAN data. If the molecule does not exist in the HITRAN database, the abundance is read from the
radis/radis_default.jsonconfiguration file, which can be modified by editingradis.configafter import or directly by editing the user~/radis.jsonuser configuration file (overwritesradis_default.json). In theradis/radis_default.jsonfile, values were calculated with a simple model based on the terrestrial isotopic abundance of each element.load_wavenum_min, load_wavenum_max (float (cm-1)) – load only specific wavenumbers.
columns (list of str) – list of columns to load. If
None, returns all columns in the file.
- Other Parameters
cache (bool, or
'regen'or'force') – ifTrue, use existing HDF5 file. IfFalseor'regen', rebuild it. If'force', crash if not cache file found. DefaultTrue.verbose (bool)
clean_cache_files (bool) – if
Trueclean downloaded cache files after HDF5 are created.return_local_path (bool) – if
True, also returns the path of the local database file.return_partition_function (bool) – if
True, also returns aPartFuncExoMolobject.engine (‘vaex’, ‘feather’) – which memory-mapping library to use. If ‘default’ use the value from ~/radis.json
output (‘pandas’, ‘vaex’, ‘jax’) – format of the output DataFrame. If
'jax', returns a dictionary of jax arrays. If'vaex', output is avaex.dataframe.DataFrameLocalNote
Vaex DataFrames are memory-mapped. They do not take any space in RAM and are extremelly useful to deal with the largest databases.
skip_optional_data (bool) – If False, fetch all fields which are marked as available in the ExoMol definition file. If True, load only the first 4 columns of the states file (“i”, “E”, “g”, “J”). The structure of the columns above 5 depend on the the definitions file (*.def) and the Exomol version. If
skip_optional_data=False, two errors may occur:a field is marked as present/absent in the *.def field but is absent/present in the *.states file (ie both files are inconsistent).
in the updated version of Exomol, new fields have been added in the states file of some species. But it has not been done for all species, so both structures exist. For instance, the states file of https://exomol.com/data/molecules/HCl/1H-35Cl/HITRAN-HCl/ follows the structure described in [1]_, unlike the states file of https://exomol.com/data/molecules/NO/14N-16O/XABC/ which follows the structure described in [2]_.
- Returns
df (pd.DataFrame) – Line list A HDF5 file is also created in
local_databasesand referenced in the RADIS config file with namedatabank_namelocal_path (str) – path of local database file if
return_local_path
Examples

Compare CO xsections from the ExoMol and HITEMP database
Compare CO xsections from the ExoMol and HITEMP databaseNotes
if using
load_only_wavenum_above/beloworisotope, the whole database is anyway downloaded and uncompressed tolocal_databasesfast access .HDF5 files (which will take a long time on first call). Only the expected wavenumber range & isotopes are returned. The .HFD5 parsing useshdf2df()References
- 1
Tennyson, J., Yurchenko, S. N., Al-Refaie, A. F., Barton, E. J., Chubb, K. L., Coles, P. A., … Zak, E. (2016). The ExoMol database: molecular line lists for exoplanet and other hot atmospheres. https://doi.org/10.1016/j.jms.2016.05.002
- 2
Tennyson, J., Yurchenko, S. N., Al-Refaie, A. F., Clark, V. H. J., Chubb, K. L., Conway, E. K., … Yurchenko, O. P. (2020). The 2020 release of the ExoMol database: Molecular line lists for exoplanet and other hot atmospheres. Journal of Quantitative Spectroscopy and Radiative Transfer, 255, 107228. https://doi.org/10.1016/j.jqsrt.2020.107228
See also
- get_exomol_database_list(molecule, isotope_full_name=None)[source]
Parse ExoMol website and return list of available databases, and recommended database
- Parameters
molecule (str)
isotope_full_name (str) – isotope full name (ex.
12C-1H4for CH4,1). Get it fromradis.io.exomol.get_exomol_full_isotope_name()
- Return type
list of databases, database recommended by ExoMol
Examples
Get CH4 from ExoMol :
databases, recommended = get_exomol_database_list("CH4", "12C-1H4")
>>> ['xsec-YT10to10', 'YT10to10', 'YT34to10'], 'YT34to10'
Or combine with
get_exomol_full_isotope_name()to get the isopologue (sorted by terrestrial abundance)from radis.io.exomol import get_exomol_database_list, get_exomol_full_isotope_name databases, recommended = get_exomol_database_list("CH4", get_exomol_full_isotope_name("CH4", 1)) >>> ['xsec-YT10to10', 'YT10to10', 'YT34to10'], 'YT34to10'

Compare CO xsections from the ExoMol and HITEMP database
Compare CO xsections from the ExoMol and HITEMP databaseSee also


