


radis.lbl.calc module
Summary
Public (front-end) functions to calculate Spectrum with HITRAN / CDSD databanks.
Uses the SpectrumFactory class from factory.py, Spectrum from spectrum.py
and line survey from line_survey.py
Routine Listing
- calc_spectrum(wmin=None, wmax=None, wunit=cm - 1, Tgas=None, Tvib=None, Trot=None, pressure=1.01325, molecule=None, isotope='all', mole_fraction=1, diluent='air', path_length=1, databank='hitran', medium='air', wstep=0.01, truncation=50, neighbour_lines=0, cutoff=1e-27, parsum_mode='full summation', optimization='simple', chunksize=None, broadening_method='voigt', overpopulation=None, name=None, save_to='', use_cached=True, mode='cpu', export_lines=False, verbose=True, return_factory=False, **kwargs) Spectrum[source]
Calculate a
Spectrum.Can automatically download databases (HITRAN/HITEMP) or use manually downloaded local databases, under equilibrium or non-equilibrium, with or without overpopulation, using either CPU or GPU.
It is a wrapper to
SpectrumFactoryclass. For advanced used, please refer to the aforementioned class.- Parameters:
wmin, wmax (float [\(cm^{-1}\)] or
Quantity) –wavelength/wavenumber range. If no units are given, use \(cm^{-1}\)
calc_spectrum(2000, 2300, ... )   # cm-1
calc_spectrum(4000, 4200, wunit='nm', ...)
You can use arbitrary units:
import astropy.units as u
calc_spectrum(2.5*u.um, 3.0*u.um, ...)
wunit (
'nm','cm-1') – unit forwminandwmax. Default is"cm-1".Tgas (float [\(K\)]) – Gas temperature. If non equilibrium, is used for \(T_{translational}\). Default
300KTvib, Trot (float [\(K\)]) – Vibrational and rotational temperatures (for non-LTE calculations). If
None, they are at equilibrium withTgas.pressure (float [\(bar\)] or
Quantity) –partial pressure of gas in bar. Default
1.01325(1 atm). Use arbitrary units:import astropy.units as u calc_spectrum(..., pressure=20*u.mbar)
molecule (int, str, list or
None) – molecule id (HITRAN format) or name. For multiple molecules, use a list. The'isotope','mole_fraction','databank'and'overpopulation'parameters must then be dictionaries. IfNone, the molecule can be inferred from the database files being loaded. See the list of supported molecules inMOLECULES_LIST_EQUILIBRIUMandMOLECULES_LIST_NONEQUILIBRIUM. DefaultNone.isotope (int, list, str of the form
'1,2', or'all', or dict) – isotope id (sorted by relative density: (eg: 1: CO2-626, 2: CO2-636 for CO2). See [HITRAN-2020] documentation for isotope list for all species. If'all', all isotopes in database are used (this may result in larger computation times!). Default'all'.For multiple molecules, use a dictionary with molecule names as keys
isotope={'CO2':'1,2' , 'CO':'1,2,3' }mole_fraction (float or dict) – database species mole fraction. Default
1.For multiple molecules, use a dictionary with molecule names as keys
mole_fraction={'CO2': 0.8, 'CO':0.2}diluent (str or dictionary) – can be a string of a single diluent or a dictionary containing diluent name as key and its mole_fraction as value For single diluent
diluent = 'CO2'
For multiple diluents
diluent = { 'CO2': 0.6, 'H2O':0.2}
path_length (float [\(cm\)] or
Quantity) –slab size. Default
1cm. Use arbitrary units:import astropy.units as u calc_spectrum(..., path_length=1000*u.km)
databank (str or dict) – can be either: -
'hitran', to fetch the latest HITRAN versionthrough
fetch_hitran()(download full database with [HAPI]) orfetch_astroquery()(download only the required range). To use one mode or the other, usedatabank=('hitran', 'full') # download and cache full database, all isotopes databank=('hitran', 'range') # download and cache required range, required isotope
'hitemp', to fetch the latest HITEMP version throughfetch_hitemp(). Downloads all lines and all isotopes.'exomol', to fetch the latest ExoMol database throughfetch_exomol(). To download a specific database use (more info in fetch_exomol)databank=('exomol', 'EBJT') # 'EBJT' is a specific ExoMol database name
'geisa', to fetch the GEISA 2020 database throughfetch_geisa(). Downloads all lines and all isotopes.the name of a a valid database file, in which case the format is inferred. For instance,
'.par'is recognized ashitran/hitempformat. Accepts wildcards'*'to select multiple filesdatabank='PATH/TO/co_*.par'
the name of a spectral database registered in your
~/radis.jsonconfiguration filedatabank='MY_SPECTRAL_DATABASE'
Default
'hitran'. SeeDatabankLoaderfor more information on line databases, andDBFORMATfor your~/radis.jsonfile format.For multiple molecules, use a dictionary with molecule names as keys:
databank='hitran'     # automatic download (or 'hitemp')
databank='PATH/TO/05_HITEMP2019.par'    # path to a file
databank='*CO2*.par' #to get all the files that have CO2 in their names (case insensitive)
databank='HITEMP-2019-CO'   # user-defined database in Configuration file
databank = {'CO2' : 'PATH/TO/05_HITEMP2019.par', 'CO' : 'hitran'}  # for multiple molecules
- Other Parameters:
medium (
'air','vacuum') – propagating medium when giving inputs with'wavenum_min','wavenum_max'. Does not change anything when giving inputs in wavenumber. Default ``’air’``wstep (float (\(cm^{-1}\)) or
'auto') – Resolution of wavenumber grid. Default0.01cm-1. If'auto', it is ensured that there are slightly more or less thanradis.config['GRIDPOINTS_PER_LINEWIDTH_WARN_THRESHOLD']points for each linewidth.Note
wstep = ‘auto’ is optimized for performances while ensuring accuracy, but is still experimental in 0.9.30. Feedback welcome!
truncation (float (\(cm^{-1}\))) – Half-width over which to compute the lineshape, i.e. lines are truncated on each side after
truncation(\(cm^{-1}\)) from the line center. IfNone, use no truncation (lineshapes spread on the full spectral range). Default is300\(cm^{-1}\)Note
Large values (>
50) can induce a performance drop (computation of lineshape typically scale as \(~truncation ^2\) ). The default300was chosen to maintain a good accuracy, and still exhibit the sub-Lorentzian behavior of most lines far (few hundreds \(cm^{-1}\)) from the line center.neighbour_lines (float (\(cm^{-1}\))) – The calculated spectral range is increased (by
neighbour_linescm-1 on each side) to take into account overlaps from out-of-range lines. Default is0\(cm^{-1}\).cutoff (float (~ unit of Linestrength: \(cm^{-1}/(molec.cm^{-2})\))) – discard linestrengths that are lower that this, to reduce calculation times.
1e-27is what is generally used to generate line databases such as CDSD. If0, no cutoff. Default1e-27.parsum_mode (‘full summation’, ‘tabulation’) – how to compute partition functions, at nonequilibrium or when partition function are not already tabulated.
'full summation': sums over all (potentially millions) of rovibrational levels.'tabulation': builds an on-the-fly tabulation of rovibrational levels (500 - 4000x faster and usually accurate within 0.1%). Default'full summation'Note
parsum_mode= ‘tabulation’ is new in 0.9.30, and makes nonequilibrium calculations of small spectra extremely fast. Will become the default after 0.9.31.
optimization (
"simple","min-RMS",None) – If either"simple"or"min-RMS"LDM optimization for lineshape calculation is used:"min-RMS": weights optimized by analytical minimization of the RMS-error (See: [Spectral-Synthesis-Algorithm])"simple": weights equal to their relative position in the grid
If using the LDM optimization, broadening method is automatically set to
'fft'. IfNone, no lineshape interpolation is performed and the lineshape of all lines is calculated. Refer to [Spectral-Synthesis-Algorithm] for more explanation on the LDM method for lineshape interpolation. Default"simple".overpopulation (dict) – dictionary of overpopulation compared to the given vibrational temperature. Default
None. Example:overpopulation = {'CO2' : {'(00`0`0)->(00`0`1)': 2.5, '(00`0`1)->(00`0`2)': 1, '(01`1`0)->(01`1`1)': 1, '(01`1`1)->(01`1`2)': 1 } }export_lines (boolean) – if
True, saves details of all calculated lines in Spectrum. This is necessary to later useline_survey(), but can take some space. DefaultFalse.name (str) – name of the output Spectrum. If
None, a unique ID is generated.save_to (str) – save to a
specfile which contains absorption & emission features, all calculation parameters, and can be opened withload_spec(). File can be reloaded and exported to text formats afterwards, seesavetxt(). If file already exists, replace.use_cached (boolean) – use cached files for line database and energy database. Default
True.verbose (boolean, or int) – If
False, stays quiet. IfTrue, tells what is going on. If>=2, gives more detailed messages (for instance, details of calculation times). DefaultTrue.mode (
'cpu','gpu','emulated_gpu') – if set to'cpu', computes the spectra purely on the CPU. if set to'gpu', offloads the calculations of lineshape and broadening steps to the GPU making use of parallel computations to speed up the process. Default'cpu'. Note thatmode='gpu'requires CUDA compatible hardware to execute. For more information on how to setup your system to run GPU-accelerated methods using CUDA and Cython, check GPU Spectrum Calculation on RADIS To try the GPU code without an actual GPU, you can usemode='emulated_gpu'. This will run the GPU equivalent code on the CPU.return_factory (bool) – if
True, return theSpectrumFactorythat computes the spectrum. Useful to access computational parameters, the line database, or to start batch-computations from a first spectrum calculation. Ex:s, sf = calc_spectrum(..., return_factory=True) sf.df1 # see the lines calculated sf.eq_spectrum(...) # new calculation without reloading the database
engine (string) – Vaex or Pandas . Default Pandas, if engine is vaex memory performance is improved
**kwargs (other inputs forwarded to SpectrumFactory) – For instance:
warnings. SeeSpectrumFactorydocumentation for more details on input.
- Returns:
Spectrum– Output spectrum:SpectrumFactory– if usingreturn_factory=True, the Factory that generated the spectrum is returned. if calculating multiple molecules, a dictionary of factories is returned
References
.. [2] RADIS GPU support: GPU Calculations on RADIS
Examples
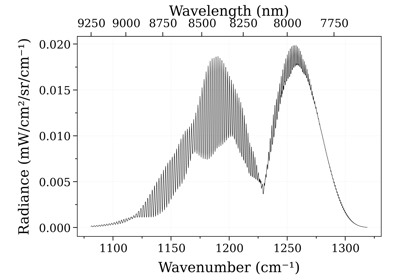
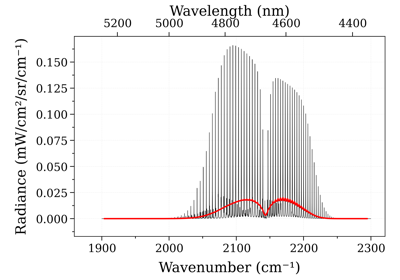
Calculate a CO spectrum from the HITRAN database:
from radis import calc_spectrum
s = calc_spectrum(1900, 2300,         # cm-1
                  molecule='CO',
                  isotope='1,2,3',
                  pressure=1.01325,   # bar
                  Tgas=1000,
                  mole_fraction=0.1,
                  databank='hitran',  # or 'hitemp'
                  diluent = "air"     # or {'CO2': 0.1, 'air':0.8}
                  )
s.apply_slit(0.5, 'nm')
s.plot('radiance')
This example uses the
apply_slit()andplot()methods. See alsoline_survey():s.line_survey(overlay='radiance')
Calculate a CO2 spectrum from the CDSD-4000 database:
s = calc_spectrum(2200, 2400,   # cm-1
                  molecule='CO2',
                  isotope='1',
                  databank='/path/to/cdsd/databank/in/npy/format/',
                  pressure=0.1,  # bar
                  Tgas=1000,
                  mole_fraction=0.1,
                  mode='gpu'
                  )

s.plot('absorbance')
This example uses the
eq_spectrum_gpu()method to calculate the spectrum on the GPU. The databank points to the CDSD-4000 databank that has been pre-processed and stored innumpy.npyformat. Refer to the online Examples for more cases, and to the Spectrum page for details on post-processing methods.For more details on how to use the GPU method and process the database, refer to the examples linked above and the documentation on GPU support for RADIS. Other Examples ————–
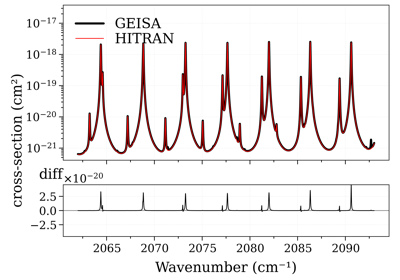
Compare CO cross-sections from HITRAN, HITEMP, GEISA, and ExoMol
Compare CO cross-sections from HITRAN, HITEMP, GEISA, and ExoMol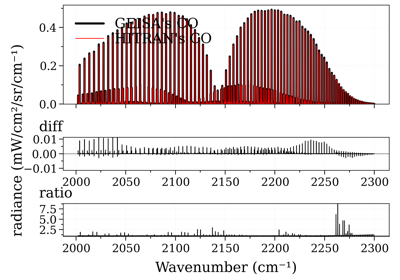
Compare CO spectrum from the GEISA and HITRAN database
Compare CO spectrum from the GEISA and HITRAN databaseReferences
cite: RADIS is built on the shoulders of many state-of-the-art packages and databases. If using RADIS to compute spectra, make sure you cite all of them, for proper reproducibility and acknowledgement of the work ! See How to cite? and the
cite()method.See also