


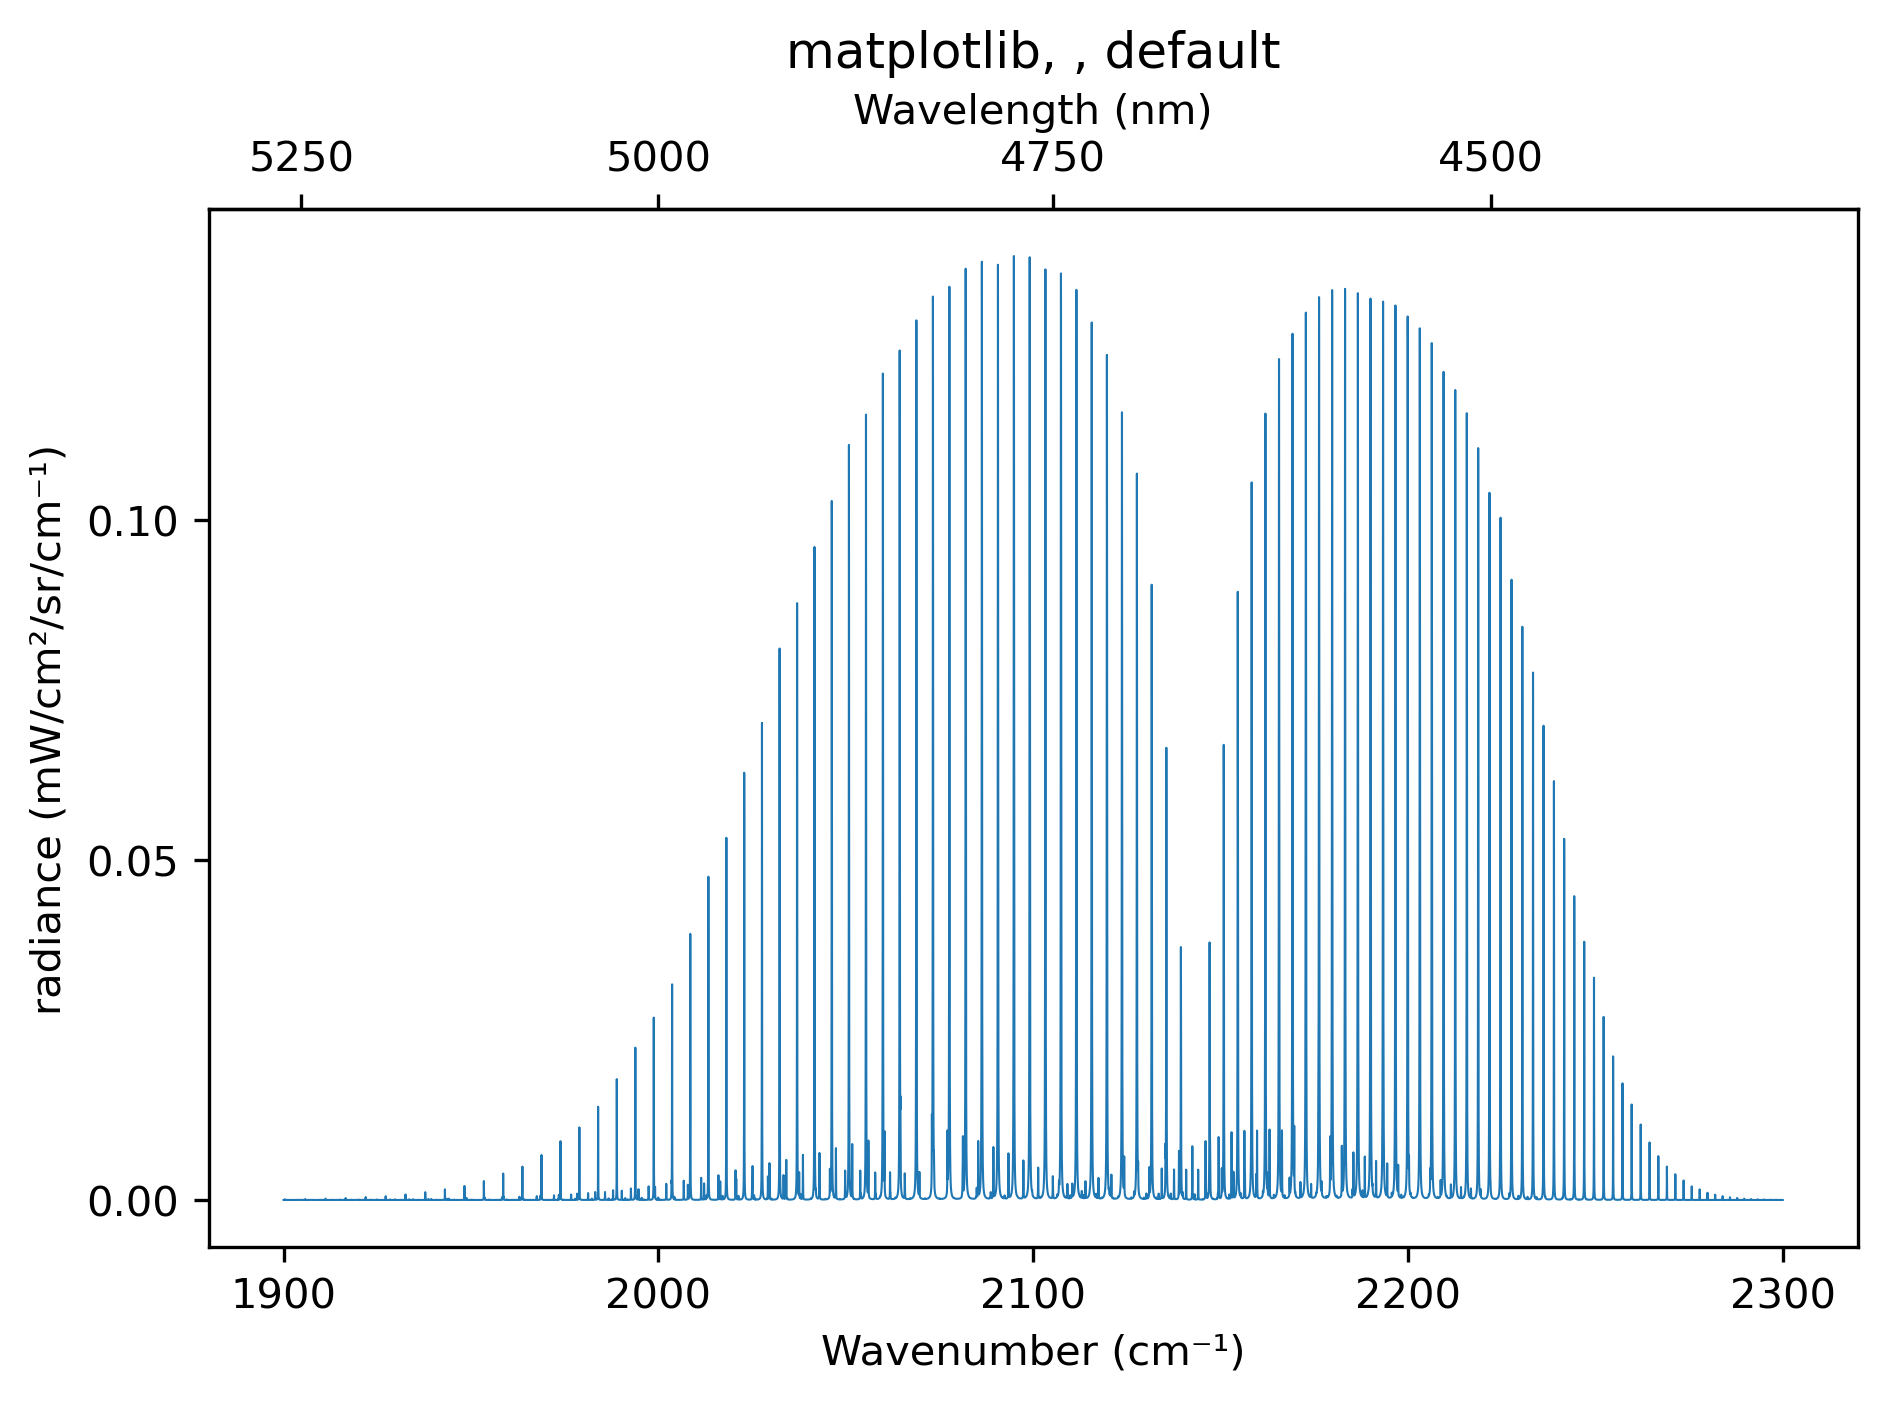
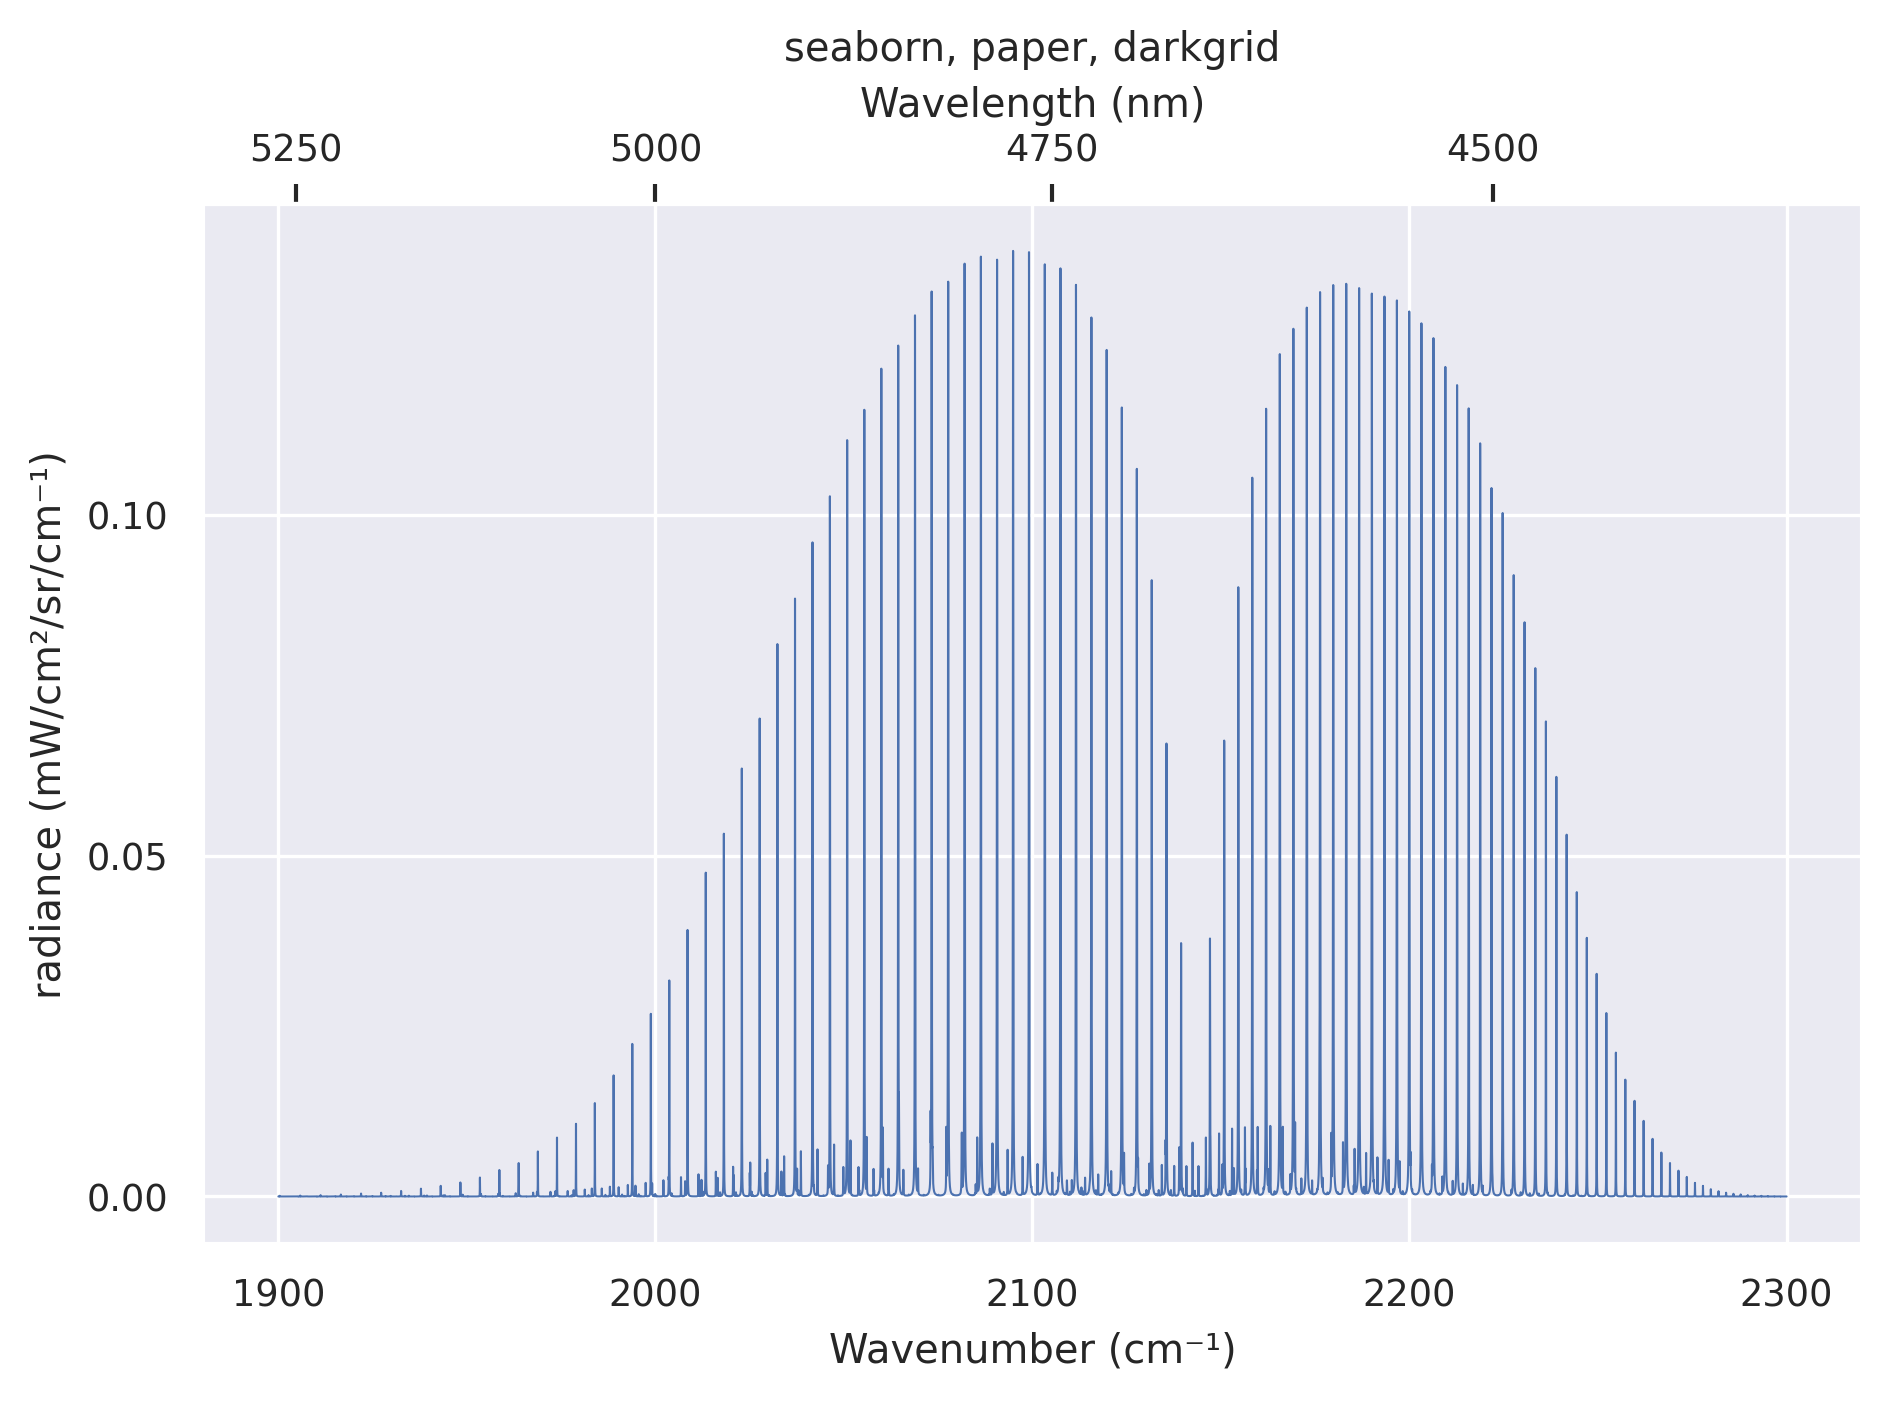
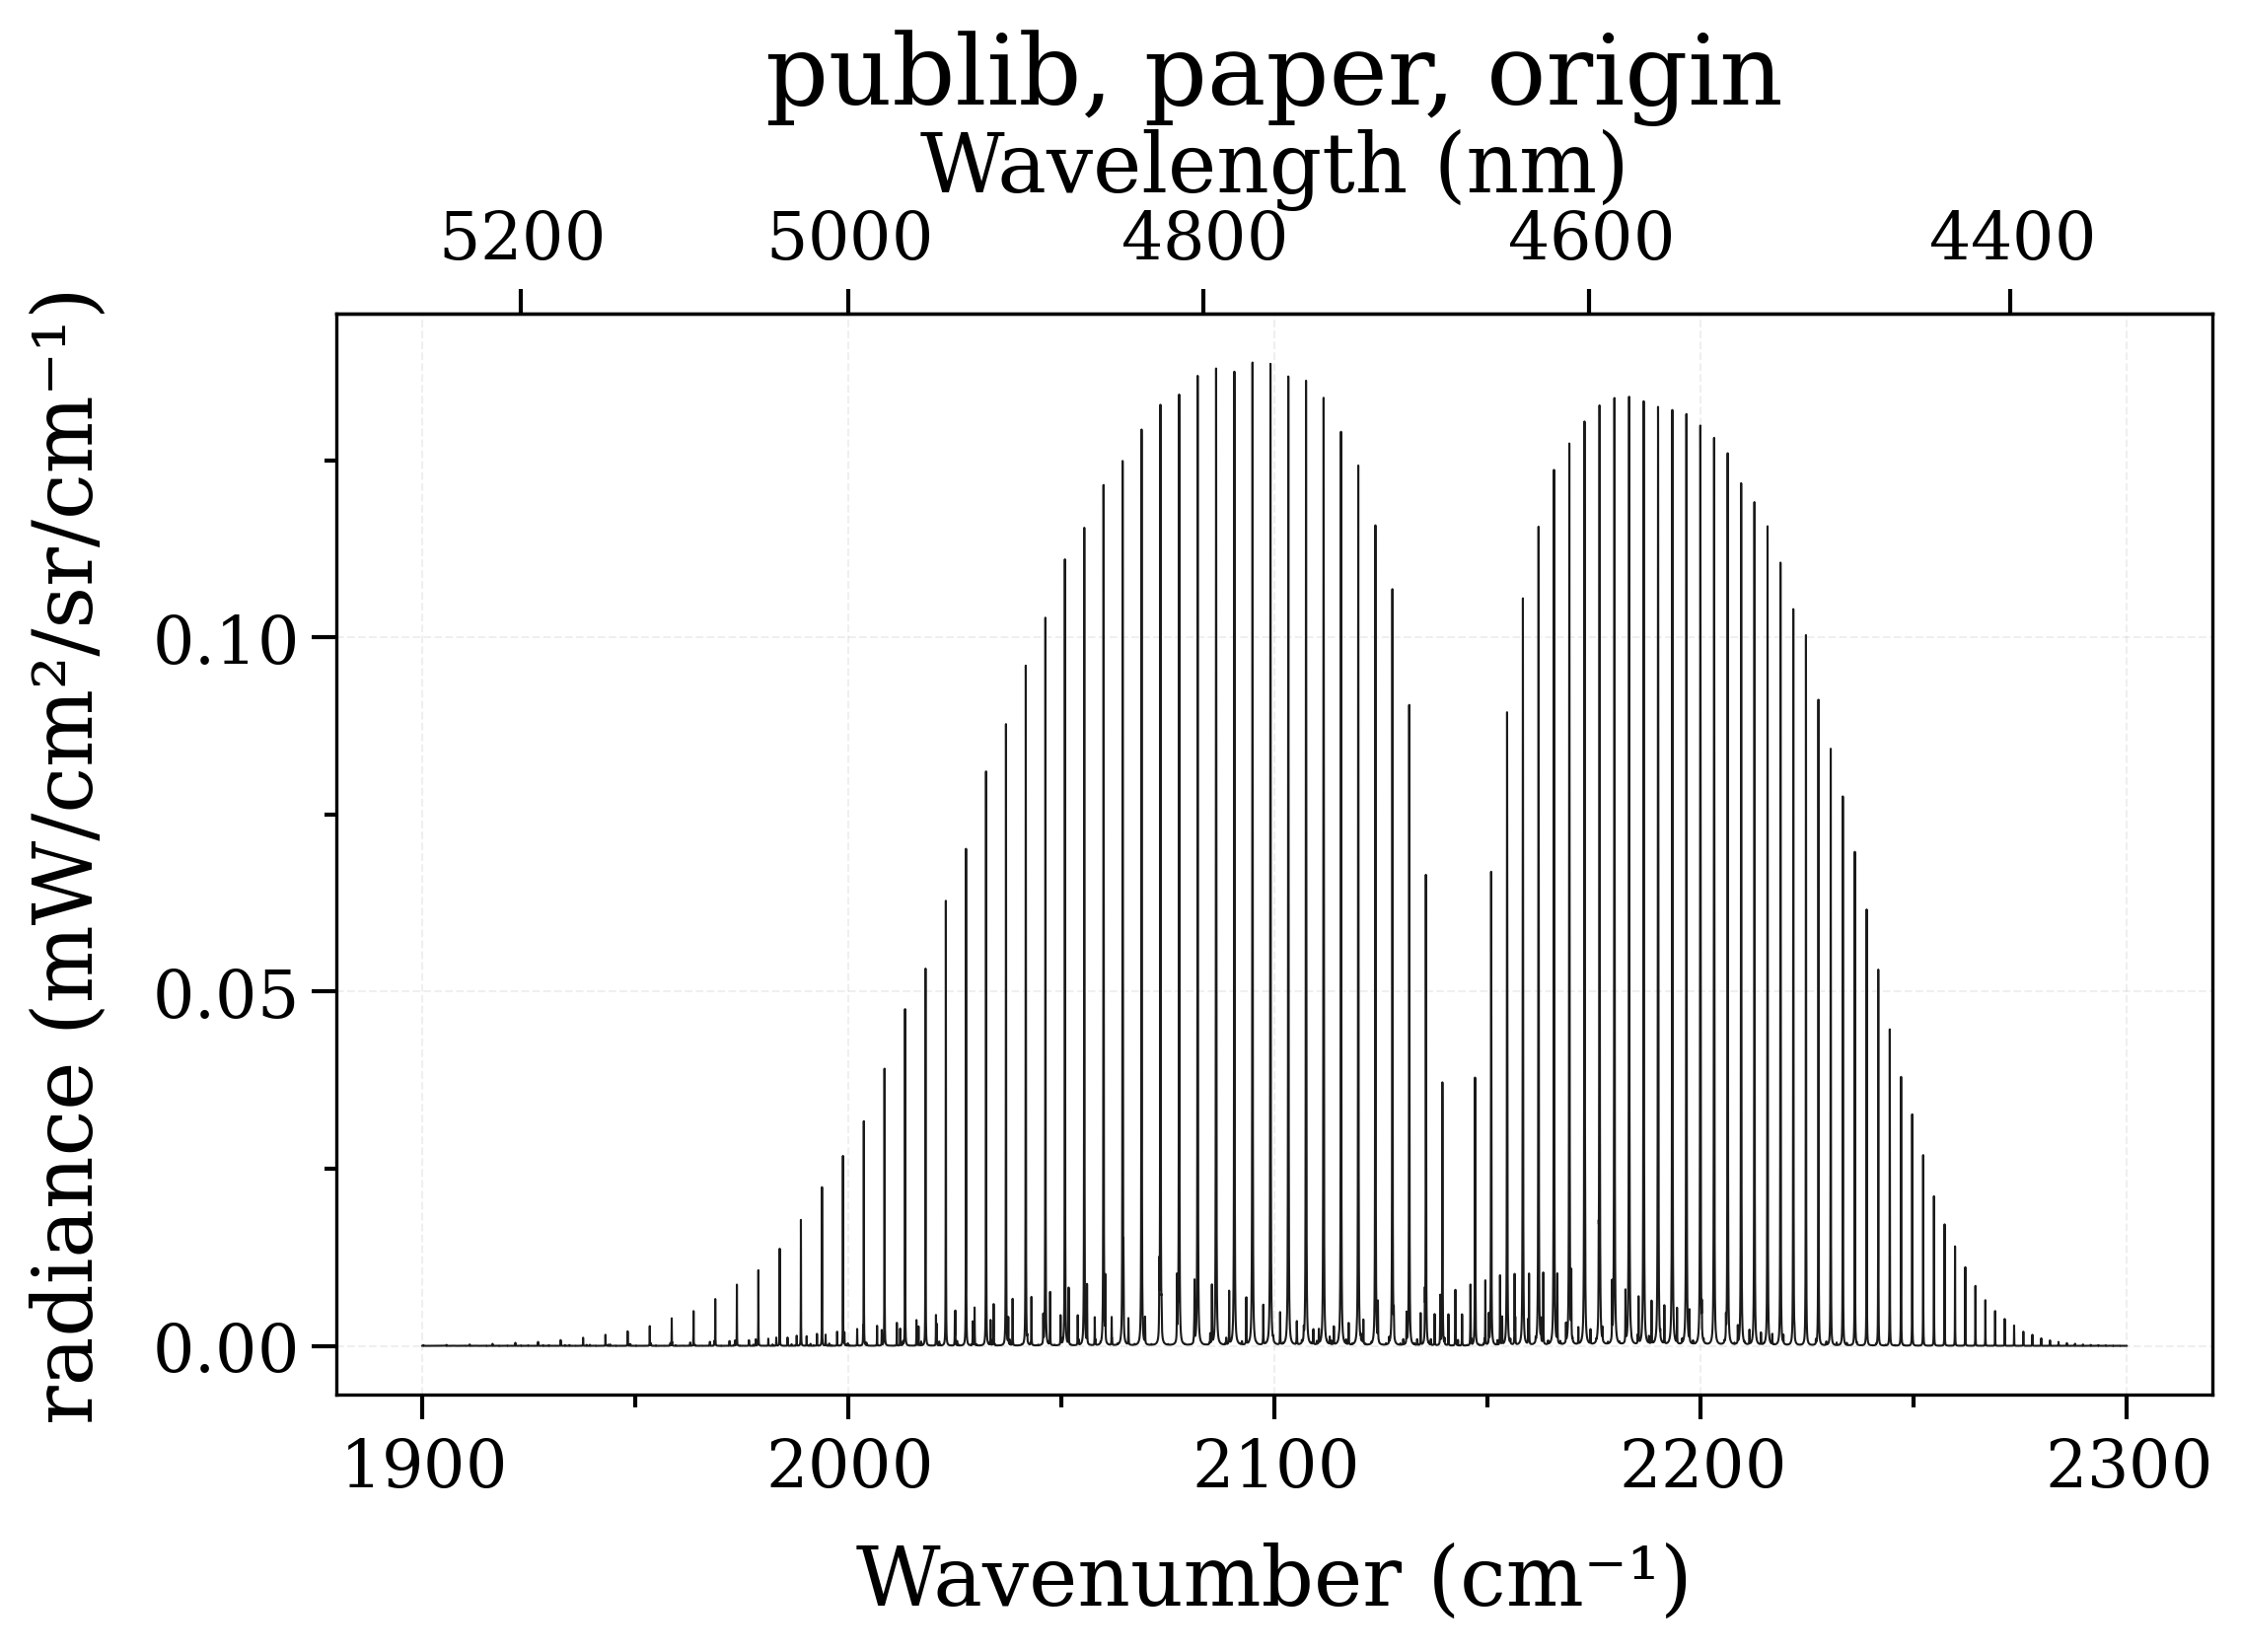
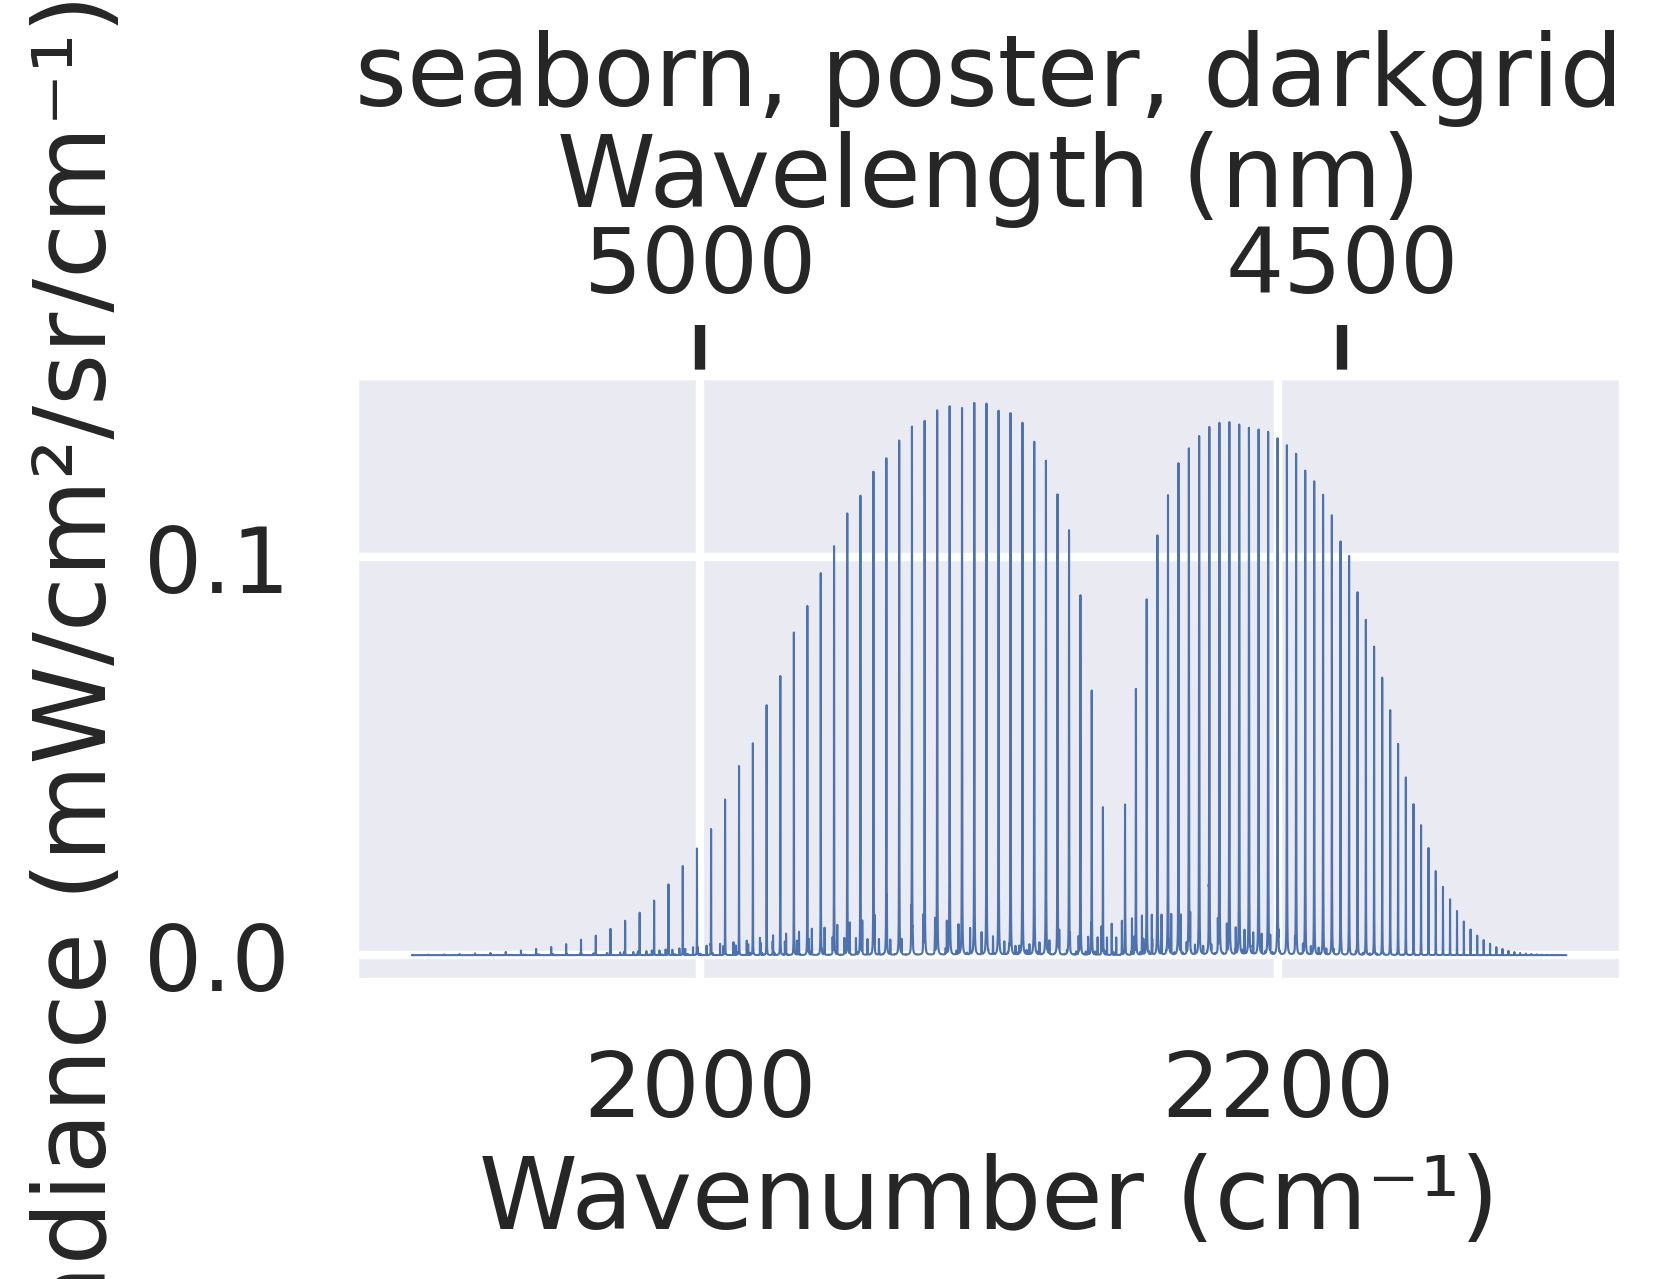
Use different plot themes
Shows how to customize plot styles, using seaborn , matplotlib
or publib
Examples
To change it in your user script, set the keys of the "plot" bloc in radis.config :
import radis
radis.config["plot"]["plotlib"] = "seaborn"
radis.config["plot"]["context"] = "paper"
radis.config["plot"]["style"] = "darkgrid"
To change your default settings, edit the
~/radis.json Configuration file
See Also
--------------------------------------------------------------------------------
CO - HITRAN - Downloading database
--------------------------------------------------------------------------------

Download:
- All files already downloaded.

Caching to HDF5/H5 format:
- All files already cached.
0.03s - Loaded database
Calculating Equilibrium Spectrum
Physical Conditions
----------------------------------------
   Tgas                 700 K
   isotope              1,2,3
   medium               air
   mole_fraction        0.1
   path_length          1 cm
   pressure             1.01325 bar
   self_absorption      True
   species              CO
   state                X
   wavenum_max          2300.0000 cm-1
   wavenum_min          1900.0000 cm-1
Computation Parameters
----------------------------------------
   Tref                 296 K
   add_at_used          numpy
   broadening_method    voigt_poly
   cutoff               1e-27 cm-1/(#.cm-2)
   dbformat             hitran
   dbpath               /home/docs/.radisdb/hitran/CO.h5
   diluent              air
   folding_thresh       1e-06
   include_neighbouring_lines  True
   isatom               False
   isneutral            None
   lbfunc               None
   memory_mapping_engine  auto
   neighbour_lines      0 cm-1
   optimization         simple
   parsum_mode          full summation
   pfsource             default
   potential_lowering   None
   pseudo_continuum_threshold  0
   sparse_ldm           True
   truncation           50 cm-1
   waveunit             cm-1
   wstep                0.01 cm-1
   zero_padding         40002
----------------------------------------
0.05s - Spectrum calculated
import matplotlib.pyplot as plt
import radis
plt.close("all")
s = radis.spectrum_test()
for plotlib, context, style in [
("matplotlib", "", "default"),
("seaborn", "paper", "darkgrid"),
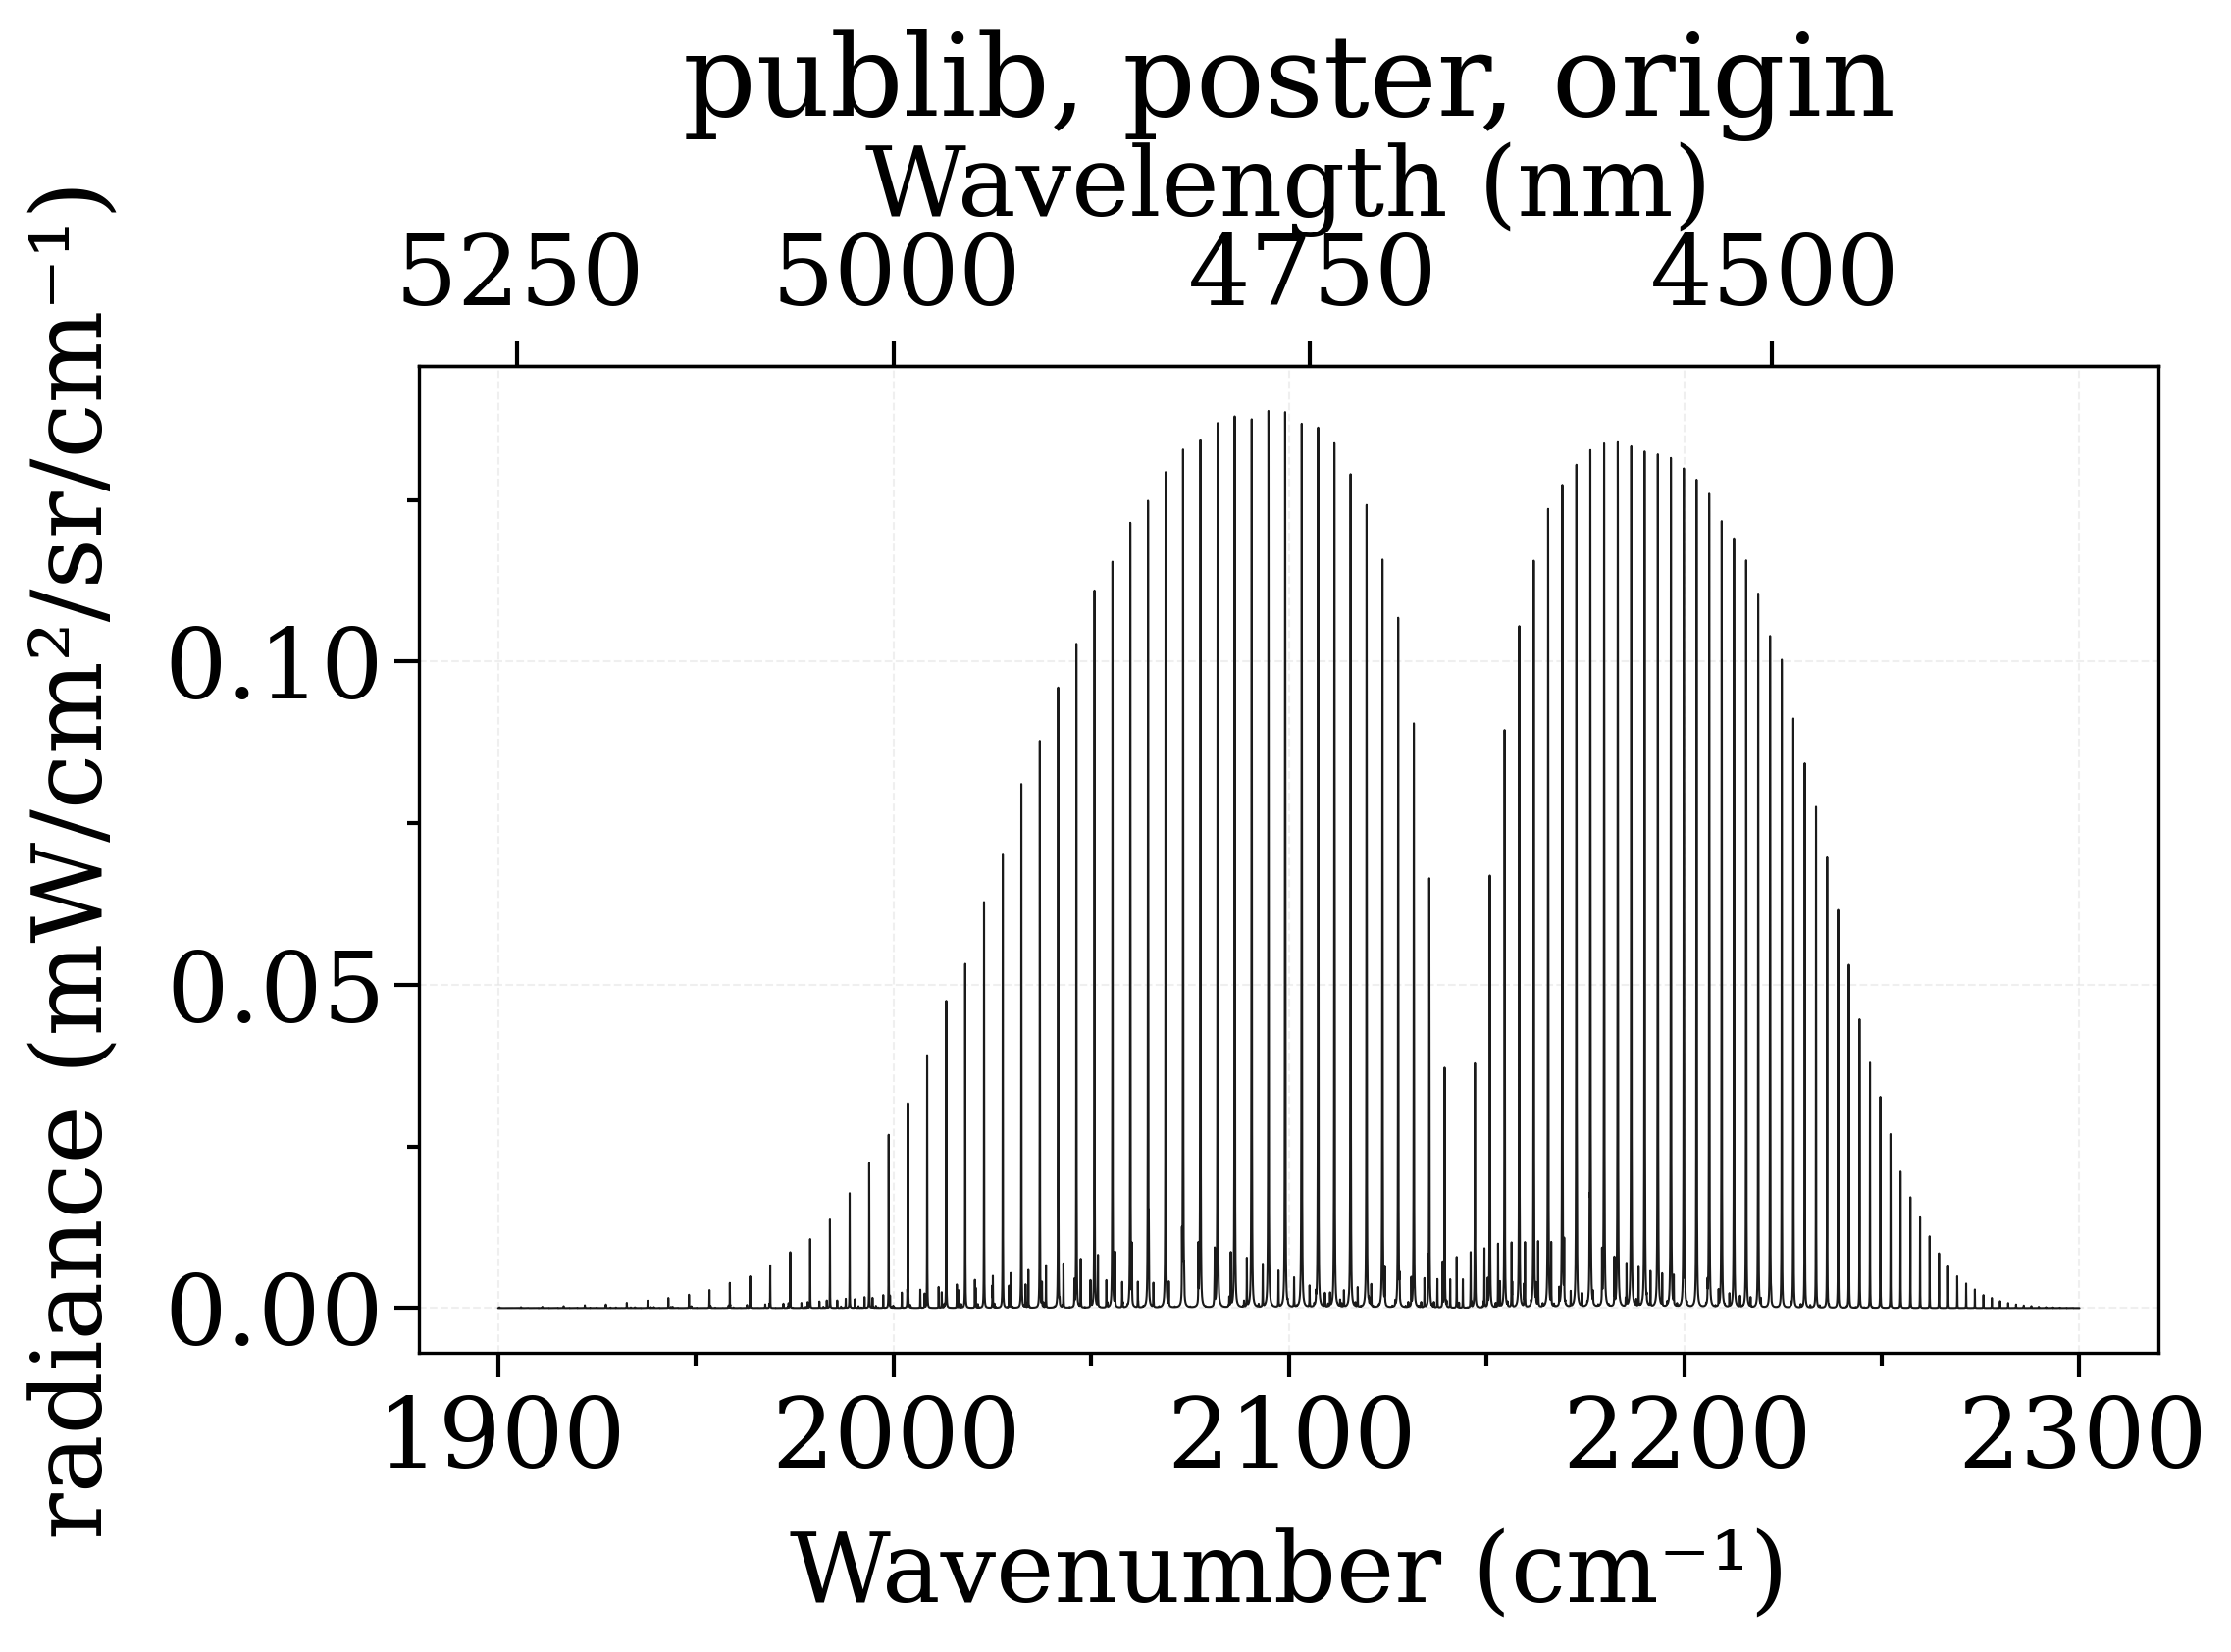
("publib", "paper", "origin"),
("seaborn", "poster", "darkgrid"),
("publib", "poster", "origin"),
]:
radis.config["plot"]["plotlib"] = plotlib
radis.config["plot"]["context"] = context
radis.config["plot"]["style"] = style
s.plot()
plt.title(", ".join(f"{v}" for v in radis.config["plot"].values()))
plt.tight_layout()
Total running time of the script: (0 minutes 1.988 seconds)