


Post-process using Specutils
Find peaks or uncertainties using the specutils library. A Radis Spectrum
object can easily be converted to a specutils specutils.spectra.spectrum1d.Spectrum1D
using to_specutils().
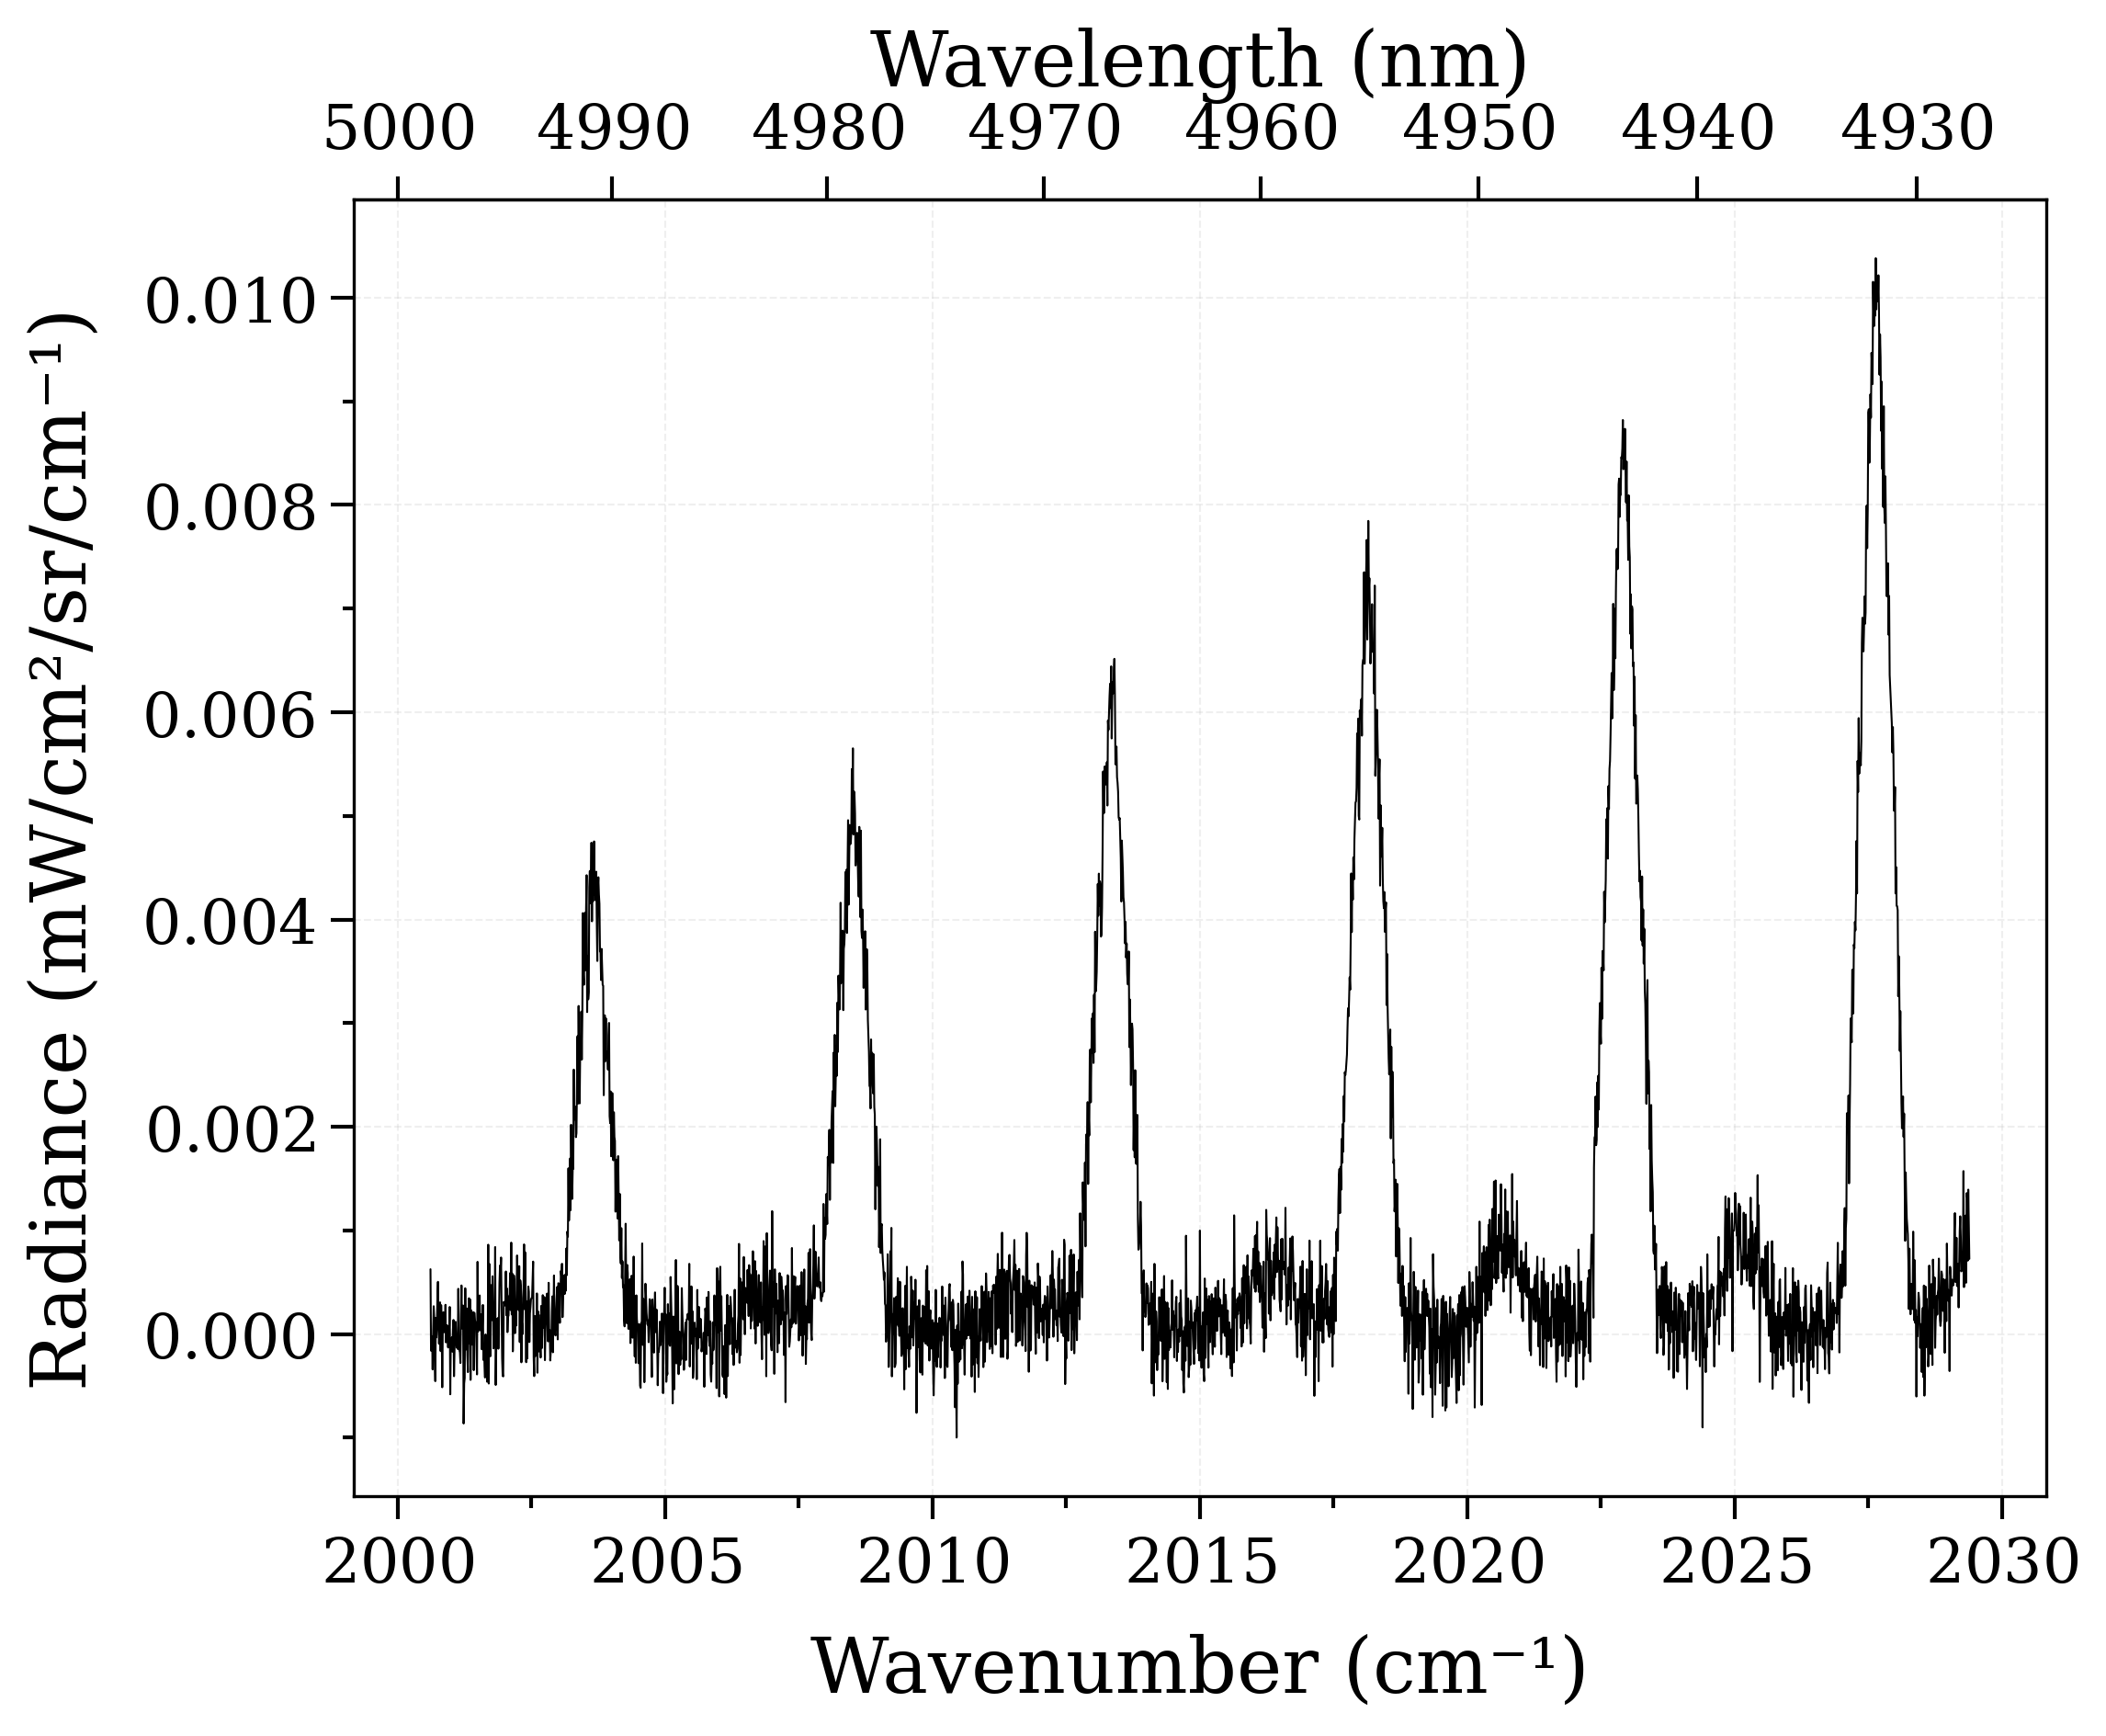
Below, we create a noisy spectrum based on a synthetic CO spectrum,
we convert it to specutils, add uncertainties by targeting a
noisy region, then determine the lines using find_lines_threshold() :
import astropy.units as u
import numpy as np

from radis import spectrum_test

""" We create a synthetic CO spectrum"""

s = (
    spectrum_test(molecule="CO", wavenum_min=2000, wavenum_max=2030)
    .apply_slit(1.5, "nm")
    .take("radiance")
)
s.trim()  # removes nans created by the slit convolution boundary effects
noise = np.random.normal(0.0, s.max().value * 0.03, len(s))
s_exp = s + noise

s_exp.plot()
--------------------------------------------------------------------------------
CO - HITRAN - Downloading database
--------------------------------------------------------------------------------

Download:
- All files already downloaded.

Caching to HDF5/H5 format:
- All files already cached.
0.03s - Loaded database
Calculating Equilibrium Spectrum
Physical Conditions
----------------------------------------
   Tgas                 700 K
   isotope              1,2,3
   medium               air
   mole_fraction        0.1
   path_length          1 cm
   pressure             1.01325 bar
   self_absorption      True
   species              CO
   state                X
   wavenum_max          2030.0000 cm-1
   wavenum_min          2000.0000 cm-1
Computation Parameters
----------------------------------------
   Tref                 296 K
   add_at_used          numpy
   broadening_method    voigt_poly
   cutoff               1e-27 cm-1/(#.cm-2)
   dbformat             hitran
   dbpath               /home/docs/.radisdb/hitran/CO.h5
   diluent              air
   folding_thresh       1e-06
   include_neighbouring_lines  True
   isatom               False
   isneutral            None
   lbfunc               None
   memory_mapping_engine  auto
   neighbour_lines      0 cm-1
   optimization         simple
   parsum_mode          full summation
   pfsource             default
   potential_lowering   None
   pseudo_continuum_threshold  0
   sparse_ldm           True
   truncation           50 cm-1
   waveunit             cm-1
   wstep                0.01 cm-1
   zero_padding         3001
----------------------------------------
0.02s - Spectrum calculated

<matplotlib.lines.Line2D object at 0x784ca86caf90>
Determine the noise level by selecting a noisy region from the graph above :
spectrum = s_exp.to_specutils()

from specutils import SpectralRegion
from specutils.manipulation import noise_region_uncertainty
from specutils.spectra import Spectrum1D

noise_region = SpectralRegion(2010.5 / u.cm, 2009.5 / u.cm)
spectrum = noise_region_uncertainty(spectrum, noise_region)
if not isinstance(spectrum, Spectrum1D):
    spectrum = Spectrum1D(
        flux=spectrum.flux,
        spectral_axis=spectrum.spectral_axis,
        uncertainty=getattr(spectrum, "uncertainty", None),
        wcs=getattr(spectrum, "wcs", None),
        mask=getattr(spectrum, "mask", None),
        meta=getattr(spectrum, "meta", None),
    )
/home/docs/checkouts/readthedocs.org/user_builds/radis/checkouts/develop/radis/spectrum/spectrum.py:4394: AstropyDeprecationWarning: The Spectrum1D class is deprecated and may be removed in a future version.
        Use Spectrum instead.
  return Spectrum1D(
/home/docs/checkouts/readthedocs.org/user_builds/radis/conda/develop/lib/python3.14/site-packages/astropy/nddata/mixins/ndslicing.py:68: AstropyDeprecationWarning: The Spectrum1D class is deprecated and may be removed in a future version.
        Use Spectrum instead.
  return self.__class__(**kwargs)
/home/docs/checkouts/readthedocs.org/user_builds/radis/conda/develop/lib/python3.14/site-packages/specutils/spectra/spectrum.py:582: AstropyDeprecationWarning: The Spectrum1D class is deprecated and may be removed in a future version.
        Use Spectrum instead.
  return self.__class__(**alt_kwargs)
/home/docs/checkouts/readthedocs.org/user_builds/radis/checkouts/develop/examples/2_Experimental_spectra/plot_specutils_processing.py:47: AstropyDeprecationWarning: The Spectrum1D class is deprecated and may be removed in a future version.
        Use Spectrum instead.
  spectrum = Spectrum1D(
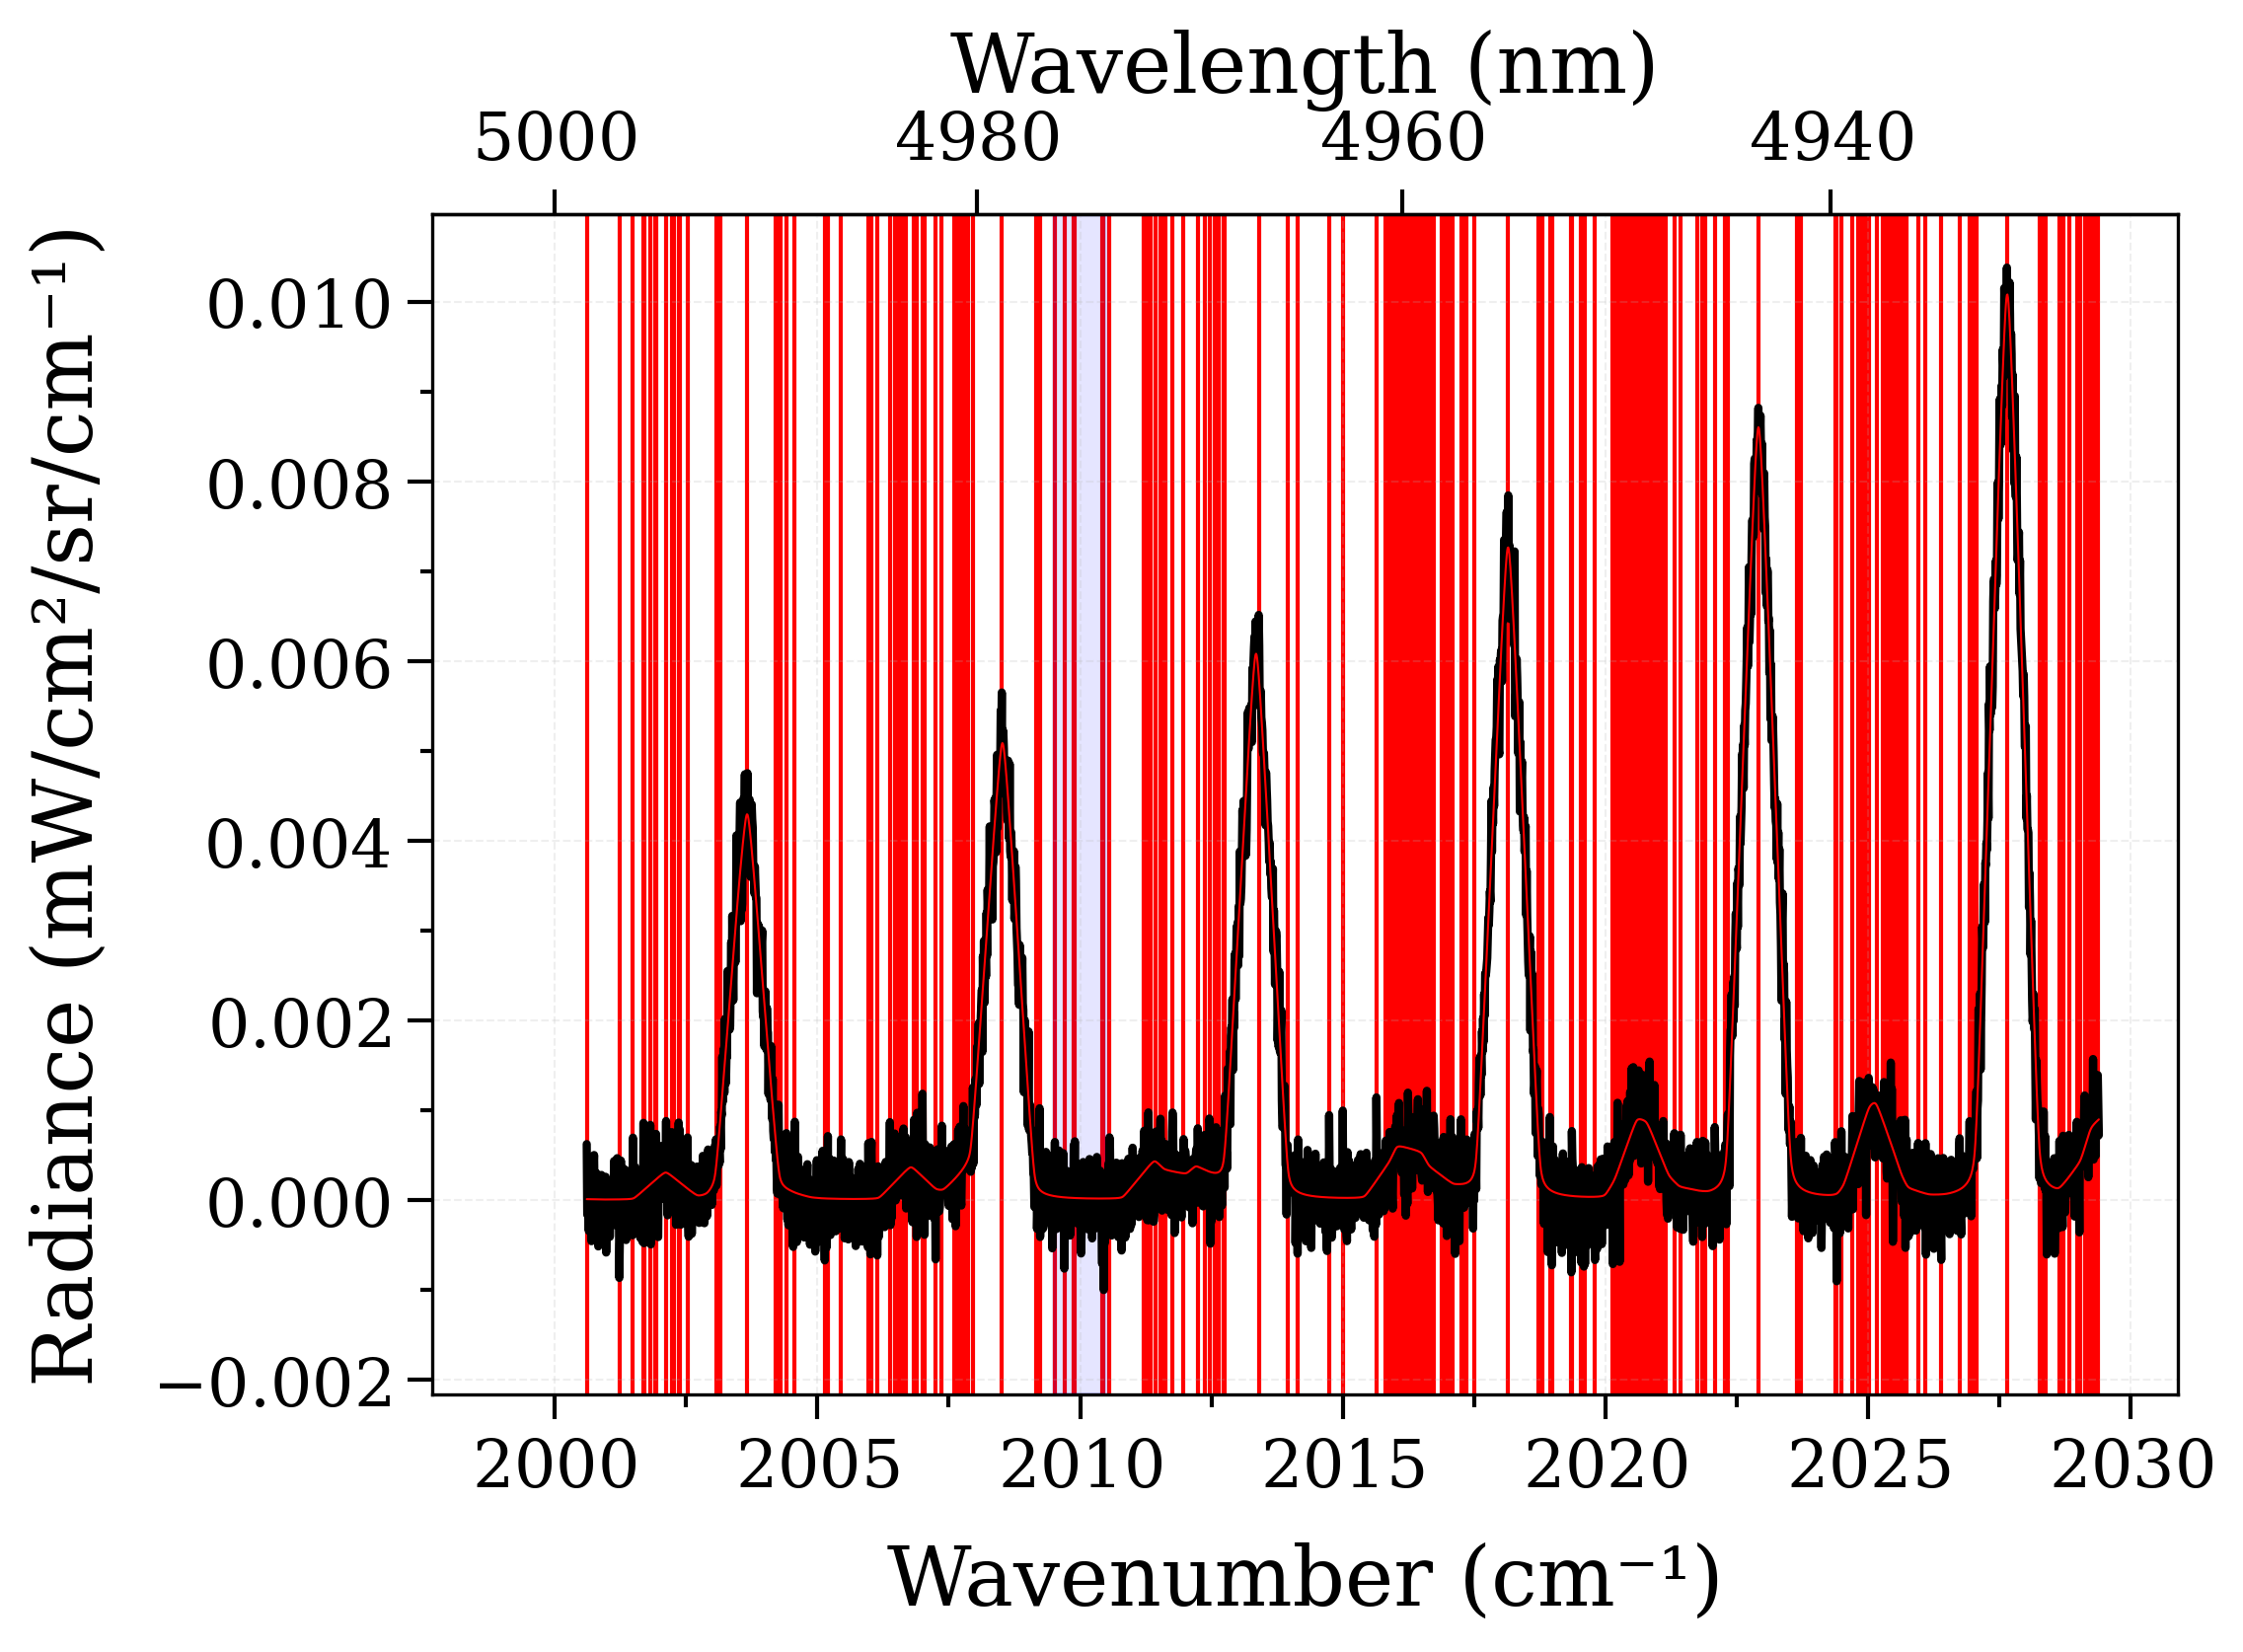
Find lines :
from specutils.fitting import find_lines_threshold

lines = find_lines_threshold(spectrum, noise_factor=2)

print(lines)


s_exp.plot(lw=2, show_ruler=True)
import matplotlib.pyplot as plt

for line in lines.to_pandas().line_center.values:
    plt.axvline(line, color="r", zorder=-1)
s.plot(nfig="same")
plt.axvspan(noise_region.lower.value, noise_region.upper.value, color="b", alpha=0.1)
/home/docs/checkouts/readthedocs.org/user_builds/radis/conda/develop/lib/python3.14/site-packages/specutils/analysis/flux.py:289: AstropyUserWarning: Spectrum is not below the threshold signal-to-noise 0.01. This may indicate you have not continuum subtracted this spectrum (or that you have but it has high SNR features).

If you want to suppress this warning either type 'specutils.conf.do_continuum_function_check = False' or see http://docs.astropy.org/en/stable/config/#adding-new-configuration-items for other ways to configure the warning.
  warnings.warn(message, AstropyUserWarning)
   line_center     line_type  line_center_index
      1 / cm
------------------ ---------- -----------------
2000.6499999999994   emission                 4
2001.3099999999988   emission                70
2001.7899999999984   emission               118
2001.8599999999983   emission               125
2001.9799999999982   emission               137
2001.9999999999982   emission               139
2002.0599999999981   emission               145
 2002.149999999998   emission               154
 2002.239999999998   emission               163
               ...        ...               ...
2001.6399999999985 absorption               103
2002.5599999999977 absorption               195
2004.6399999999958 absorption               403
 2009.929999999991 absorption               932
2010.1299999999908 absorption               952
2010.1699999999908 absorption               956
2014.5999999999867 absorption              1399
2015.1899999999862 absorption              1458
 2015.329999999986 absorption              1472
2019.5499999999822 absorption              1894
Length = 196 rows
/home/docs/checkouts/readthedocs.org/user_builds/radis/checkouts/develop/radis/tools/plot_tools.py:615: UserWarning: Couldn't add Ruler tool (still an experimental feature in RADIS : please report the error !)
  warn(

<matplotlib.patches.Rectangle object at 0x784ca94c4f50>
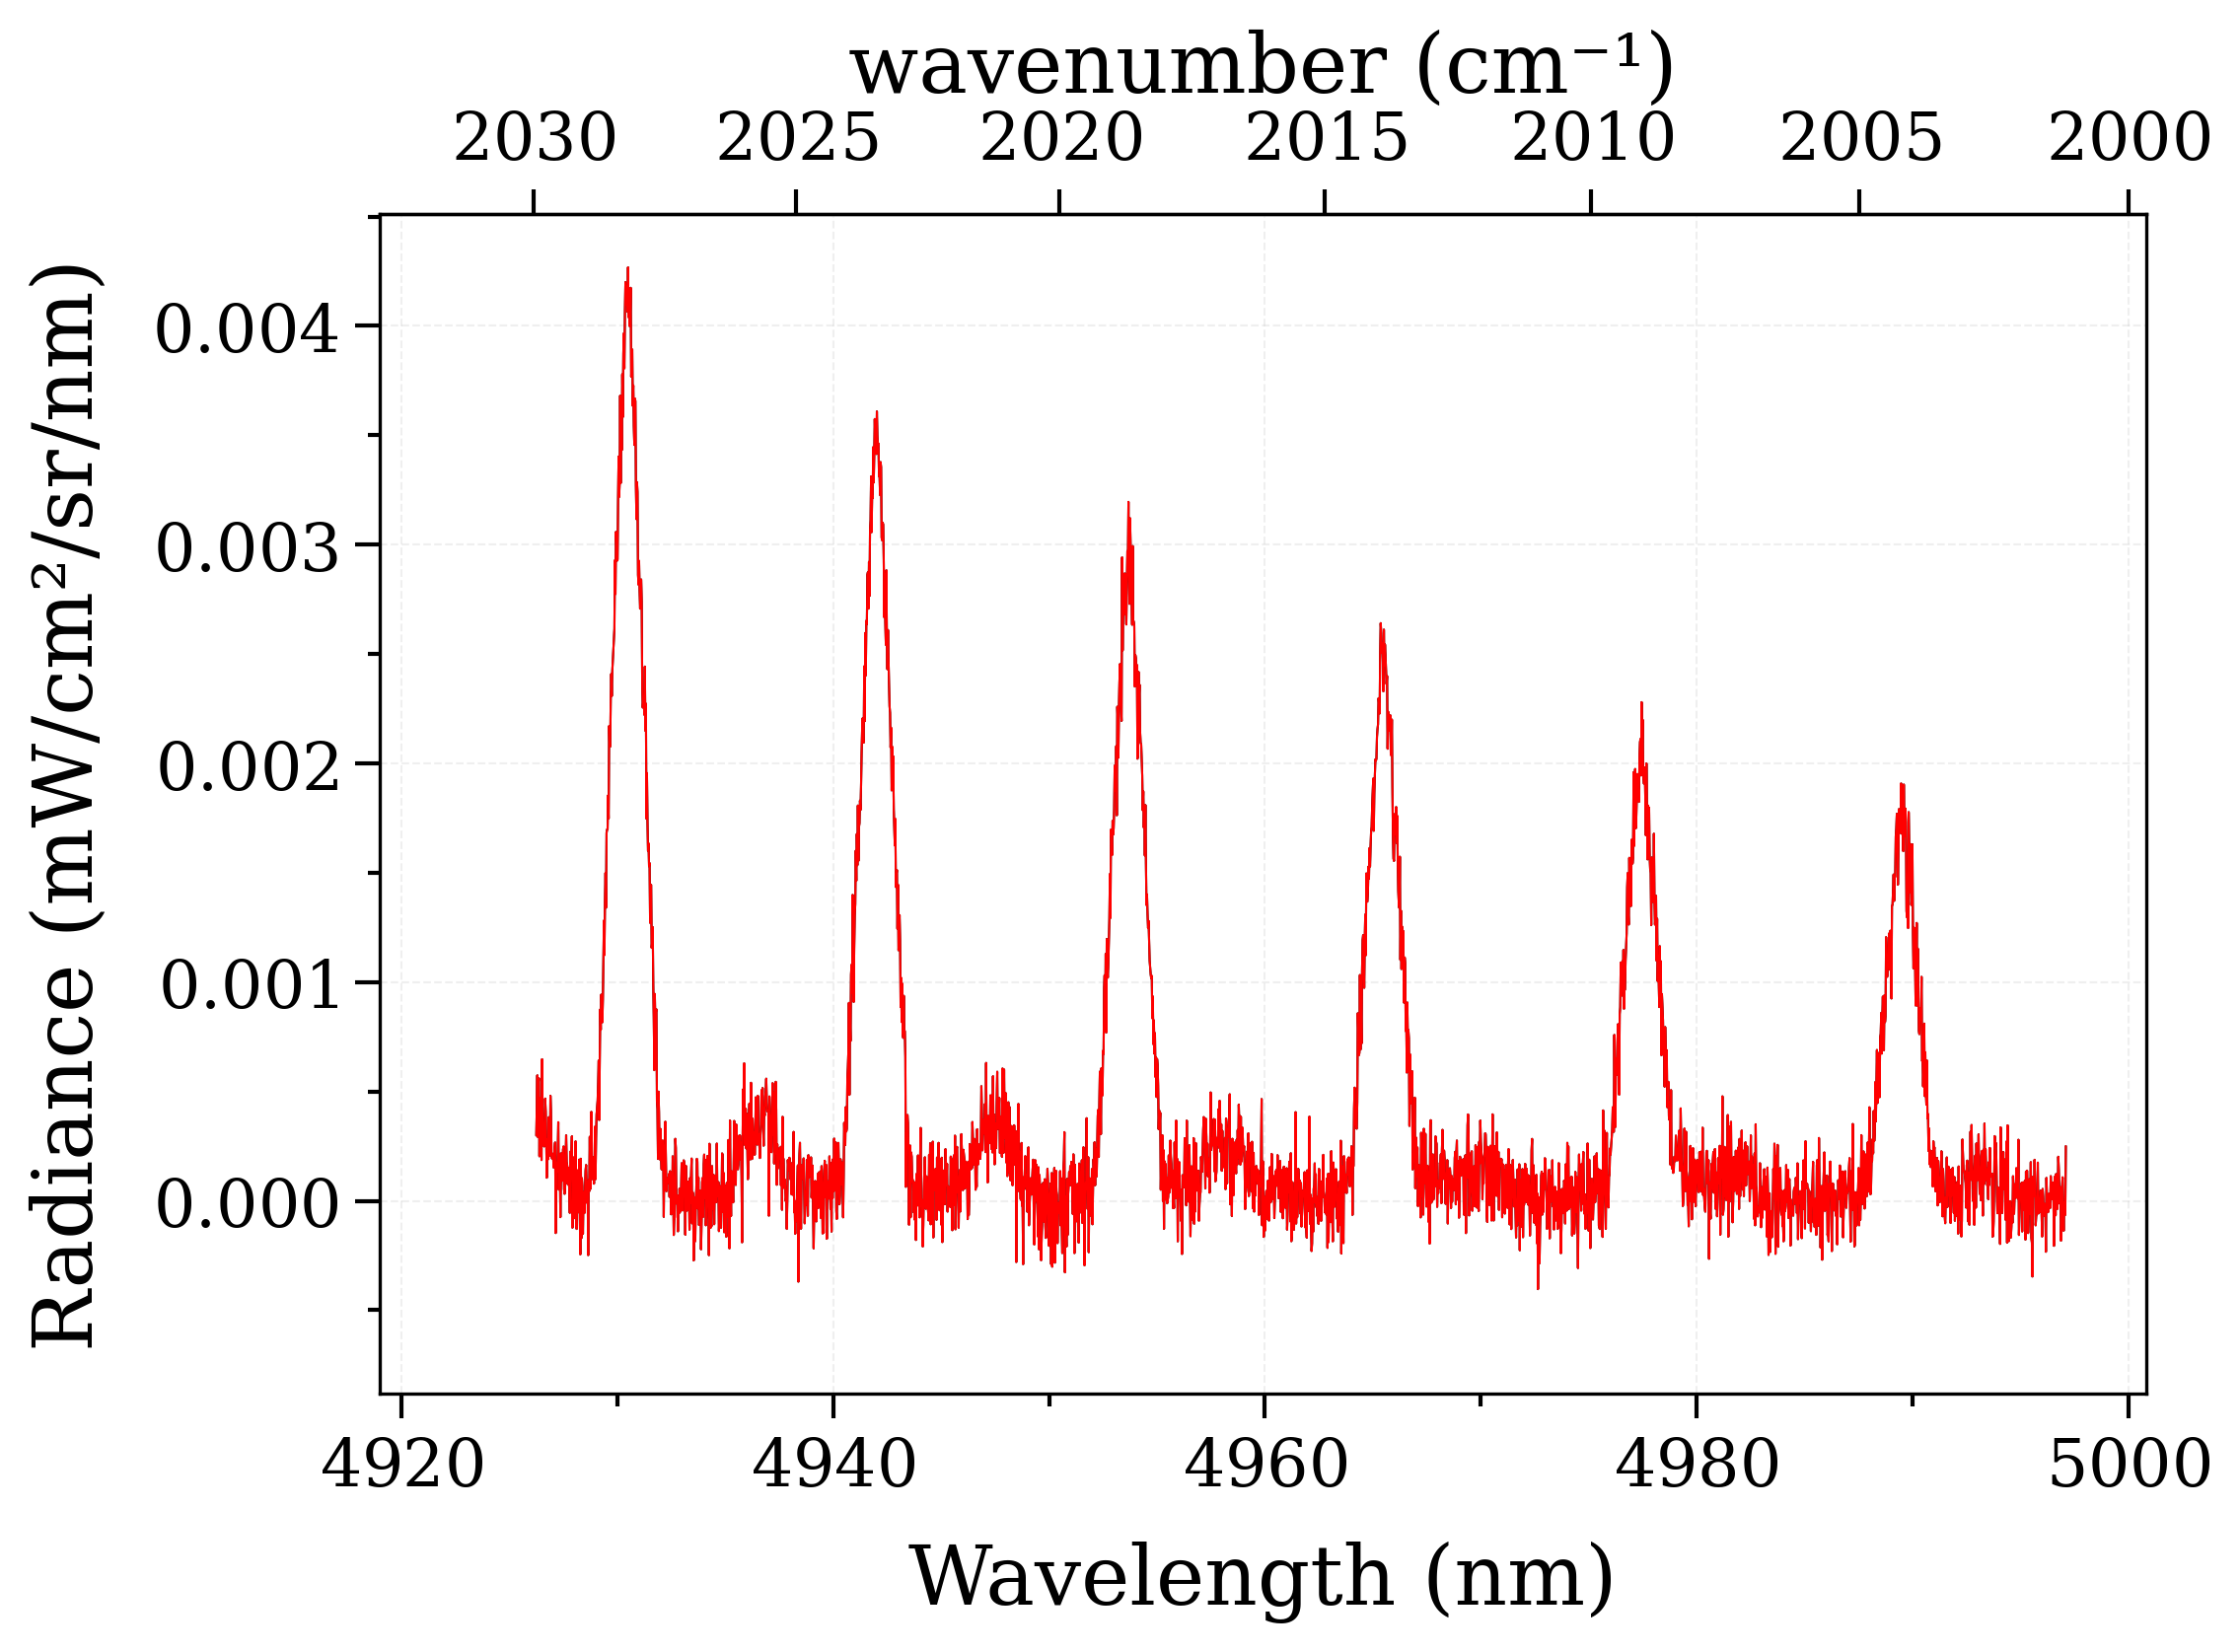
Note: we can also create a RADIS spectrum object from Specutils
specutils.spectra.spectrum1d.Spectrum1D :
from radis import Spectrum

s2 = Spectrum.from_specutils(spectrum)

s2.plot(Iunit="mW/cm2/sr/nm", wunit="nm")
s_exp.plot(Iunit="mW/cm2/sr/nm", wunit="nm", nfig="same")
assert s_exp == s2
Total running time of the script: (0 minutes 1.492 seconds)