RADIS

RADIS is a fast line-by-line code for high resolution infrared molecular spectra (emission / absorption, equilibrium / nonequilibrium).

It also includes post-processing tools to compare experimental spectra and spectra calculated with RADIS, or with other spectral codes.

Getting Started

Install

Assuming you have Python installed with the Anaconda distribution just use:

pip install radis

That’s it! You can now run your first example below. If you encounter any problem or if you need to upgrade, please refer to the detailed installation procedure. If you don’t have a Python environment, try 🌱 RADIS Online first !

Quick Start

Calculate a CO equilibrium spectrum from the [HITRAN-2020] database, using the calc_spectrum() function. Lines are downloaded automatically using Astroquery (based on [HAPI]). Output is a Spectrum object:

from radis import calc_spectrum
s = calc_spectrum(1900, 2300,         # cm-1
                  molecule='CO',
                  isotope='1,2,3',
                  pressure=1.01325,   # bar
                  Tgas=700,           # K
                  mole_fraction=0.1,
                  path_length=1,      # cm
                  databank='hitran',  # or 'hitemp', 'geisa', 'exomol'
                  )
s.apply_slit(0.5, 'nm')       # simulate an experimental slit
s.plot('radiance')
_images/co_spectrum_700K.png

Calculate a CO nonequilibrium spectrum from the HITRAN database, with arbitrary units (on your first call, this will compute and store the CO(X) rovibrational energies):

from astropy import units as u
s2 = calc_spectrum(1900 / u.cm, 2300 / u.cm,
                  molecule='CO',
                  isotope='1,2,3',
                  pressure=1.01325 * u.bar,
                  Tvib=700 * u.K,
                  Trot=300 * u.K,
                  mole_fraction=0.1,
                  path_length=1 * u.cm,
                  databank='hitran',  # or 'hitemp', 'geisa', 'exomol'
                  )
s2.apply_slit(0.5, 'nm')
s2.plot('radiance', nfig='same')    # compare with previous

Experimental spectra can be loaded using the experimental_spectrum() function and compared with the plot_diff() function. For instance:

from numpy import loadtxt
from radis import experimental_spectrum, plot_diff
w, I = loadtxt('my_file.txt').T    # assuming 2 columns
sexp = experimental_spectrum(w, I, Iunit='mW/cm2/sr/nm')
plot_diff(sexp, s)    # comparing with a spectrum 's' calculated previously

Refer to the Spectrum object guide for more post-processing functions (rescale , crop, remove baselines, store, combine along the line-of-sight, identify each line, manipulate multiple spectra at once, etc.)

More examples

Load an experimental spectrum

Load an experimental spectrum

Load an experimental spectrum
Line Survey

Line Survey

Line Survey
Blackbody radiation

Blackbody radiation

Blackbody radiation
Remove a baseline

Remove a baseline

Remove a baseline
GPU Accelerated Spectra

GPU Accelerated Spectra

GPU Accelerated Spectra
Calculate non-LTE spectra of carbon-monoxide

Calculate non-LTE spectra of carbon-monoxide

Calculate non-LTE spectra of carbon-monoxide
Use different plot themes

Use different plot themes

Use different plot themes
Calculate a large spectrum by part

Calculate a large spectrum by part

Calculate a large spectrum by part
Compare CO spectrum from the GEISA and HITRAN database

Compare CO spectrum from the GEISA and HITRAN database

Compare CO spectrum from the GEISA and HITRAN database
Calculate a spectrum from HITEMP

Calculate a spectrum from HITEMP

Calculate a spectrum from HITEMP
Calculate a spectrum from ExoMol

Calculate a spectrum from ExoMol

Calculate a spectrum from ExoMol
Real-time GPU Accelerated Spectra (Interactive)

Real-time GPU Accelerated Spectra (Interactive)

Real-time GPU Accelerated Spectra (Interactive)
See populations of computed levels

See populations of computed levels

See populations of computed levels
Spectrum Database

Spectrum Database

Spectrum Database
Compare CO xsections from the ExoMol and HITEMP database

Compare CO xsections from the ExoMol and HITEMP database

Compare CO xsections from the ExoMol and HITEMP database
Post-process using Specutils

Post-process using Specutils

Post-process using Specutils
Multi-temperature Fit

Multi-temperature Fit

Multi-temperature Fit
1 temperature fit

1 temperature fit

1 temperature fit

The Quick Start examples automatically downloaded the line databases from [HITRAN-2020], which is valid for temperatures below 700 K. For high temperature cases, you may need to use other line databases such as [HITEMP-2010] (typically T < 2000 K) or [CDSD-4000] (T < 5000 K). These databases must be described in a ~/radis.json Configuration file.

Note

📣 starting from radis==0.9.30 you can also download HITEMP and ExoMol directly. Just use databank='hitemp' or databank='exomol' in the initial example. This will automatically download, unzip and setup the database files in a ~/.radisdb folder.

More complex examples will require to use the SpectrumFactory class, which is the core of RADIS line-by-line calculations.

Refer to the Examples and Example Gallery sections for more examples, and to the User Documentation for more details on the code. You can also ask questions on the Q&A Forum or on the community chats on Gitter or Slack

Gitter Slack

In the browser (no installation needed!)

Alternatively, you can also run RADIS directly in the browser with the RADIS Interactive Examples project. For instance, run the Quick Start example on the link below:

https://mybinder.org/v2/gh/radis/radis-examples/master?filepath=first_example.ipynb

Or use 🌱 RADIS-lab to start a full online environment for advanced spectrum processing and comparison with experimental data :

https://mybinder.org/v2/gh/radis/radis-lab/main?urlpath=lab/tree/compare_with_experiment.ipynb

Cite

RADIS is built on the shoulders of many state-of-the-art packages and databases. If using RADIS to compute spectra, make sure you cite all of them, for proper reproducibility and acknowledgement of the work ! See How to cite?


Content

  • The Line-by-line (LBL) module

    This is the core of RADIS: it calculates the spectral densities for a homogeneous slab of gas, and returns a Spectrum object. Calculations are performed within the SpectrumFactory class. calc_spectrum() is a high-level wrapper to SpectrumFactory for most simple cases.

  • Line-of-sight (LOS) module

    This module takes several Spectrum objects as input and combines then along the line-of-sight (SerialSlabs()) or at the same spatial position (MergeSlabs()), to reproduce line-of-sight experiments. The module allows combination of Spectra such as:

    s_line_of_sight = (s_plasma_CO2 // s_plasma_CO) > (s_room_absorption)
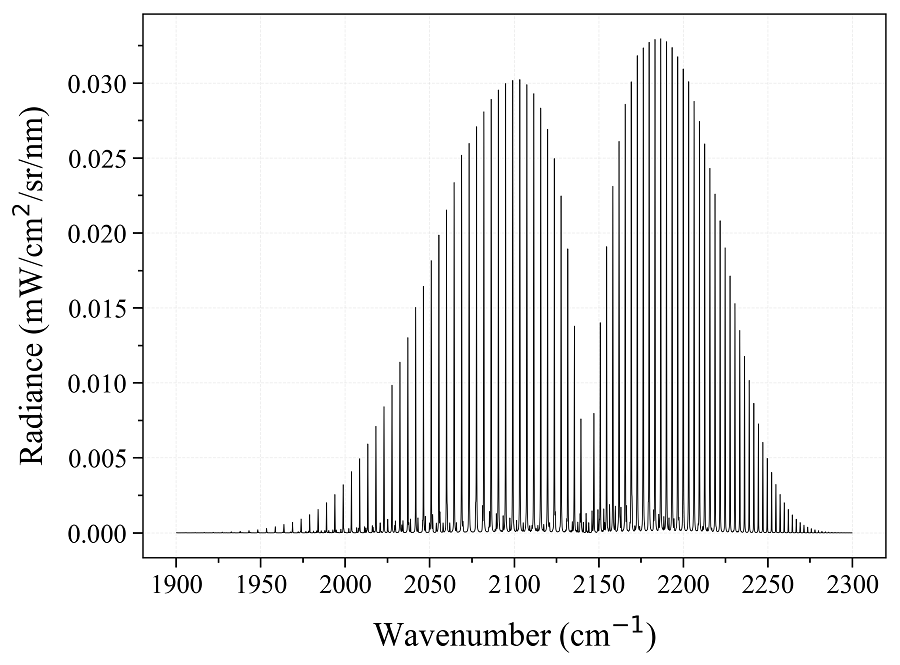
    
  • The Spectrum object guide

    This module contains the Spectrum object itself, with several methods that can be applied after the Spectrum was calculated: rescale, apply instrumental slit function, store or retrieve from a Spectrum database, plot or compare with another Spectrum object.


Q&A Forum

PyPI Downloads Article Documentation Status License Contributors Tests Coverage https://mybinder.org/v2/gh/radis/radis-examples/master?filepath=radis_online.ipynb Gitter Slack

GitHub